
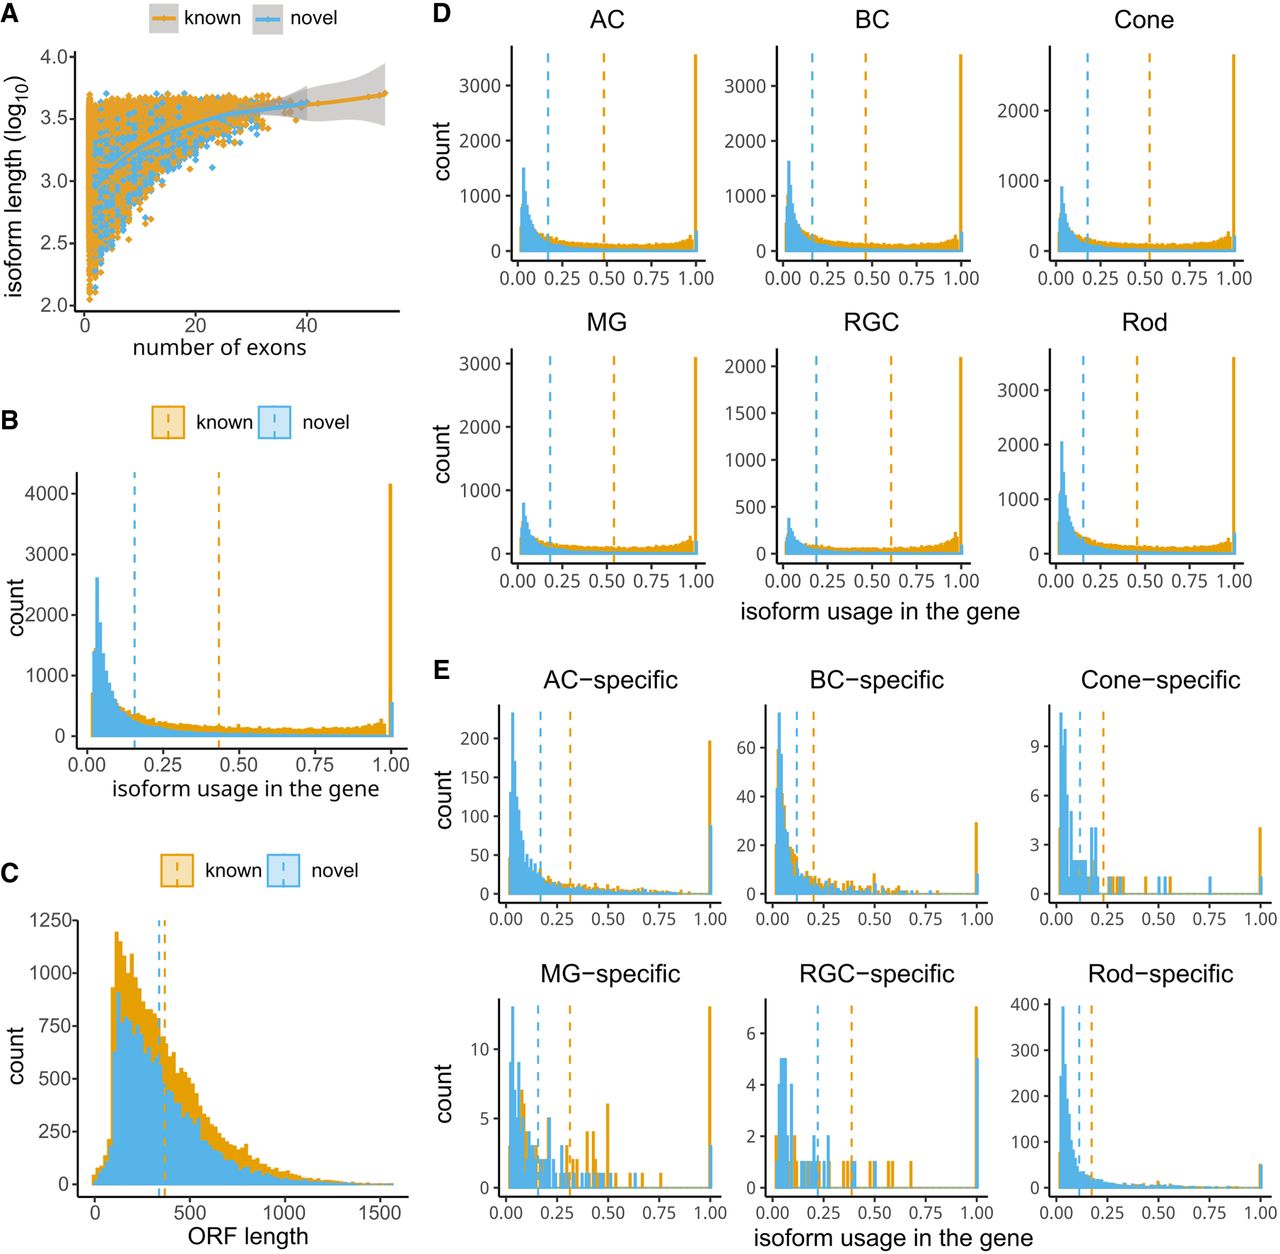
Figure 3.
Comparison of novel and known isoforms in general and across different cell classes. (A) Scatter plot showing isoform length and exon numbers for known and novel isoforms. (B) Histogram showing the distribution of known and novel isoforms on expression level in the gene. (C) Histogram showing the distribution of known and novel isoforms on ORF length. (D) Histogram showing the distribution of known and novel isoforms expressed in different cell classes on expression level in the gene. (E) Histogram showing the distribution of cell class–specific known and novel isoforms on expression level in the gene.


