
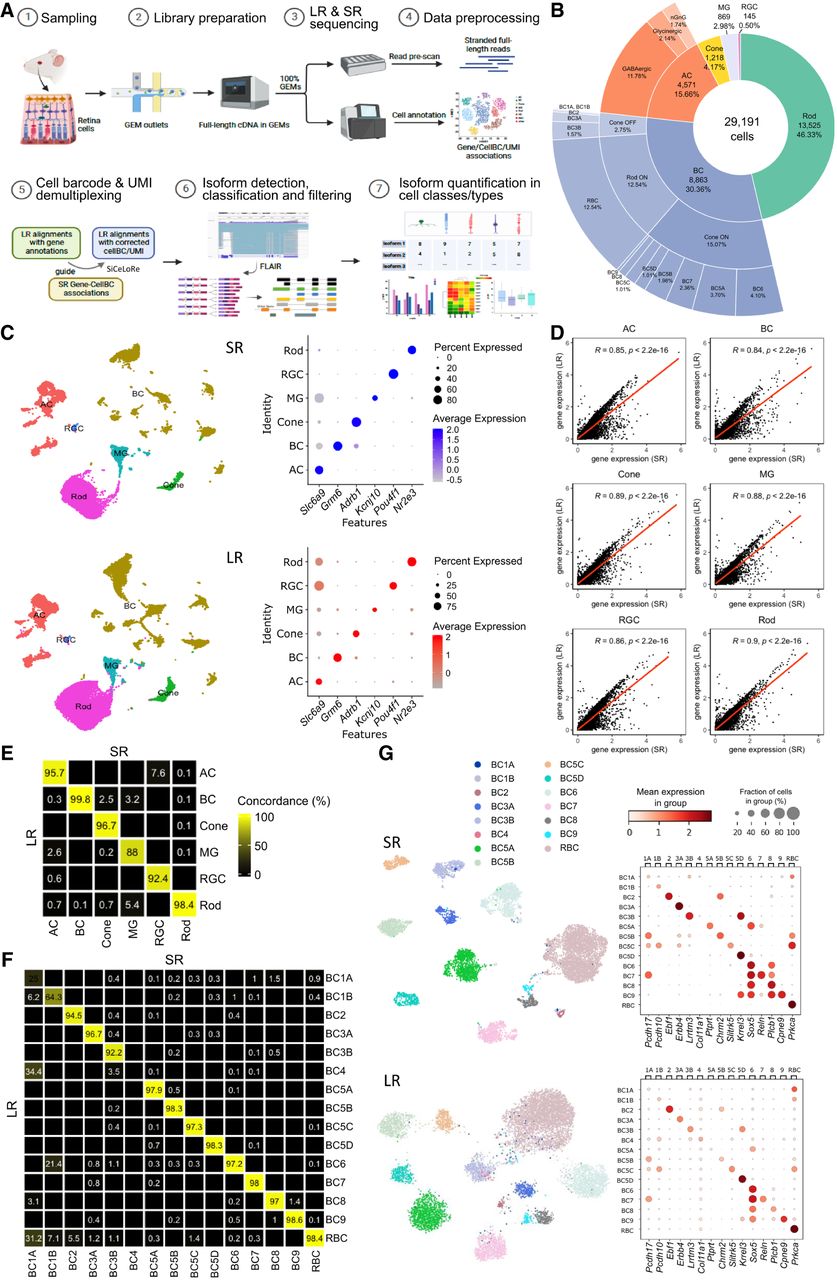
Overview of the experimental design and basic summary statistics between Illumina short-read (SR) and ONT long-read (LR) scRNA-seq. (A) Summary of the study design, with an overview of the Illumina SR and ONT LR scRNA-seq data processing pipeline. (B) Summary of cell count in each major retina cell class and subclass. (C) Uniform Manifold Approximation and Projection (UMAP) visualization of cells in each major retina cell class for SR (left upper) and LR (left lower) and dot plots for viewing the expression level of known major cell class markers between SR (right upper) and LR (right lower) data. (D) Scatter plot for single-cell gene expression levels calculated by two approaches in each major retina cell class. (E) Concordance of major cell class annotation results between SR and LR. Only cells detected in both approaches were shown here. (F) Concordance of BC type annotation results between SR and LR approaches. Only cells detected in both approaches were shown here. (G) UMAP visualization of cells in each BC type for SR (left upper) and LR (left lower) and dot plots for viewing the expression level of known BC type markers between SR (right upper) and LR (right lower) data.


