
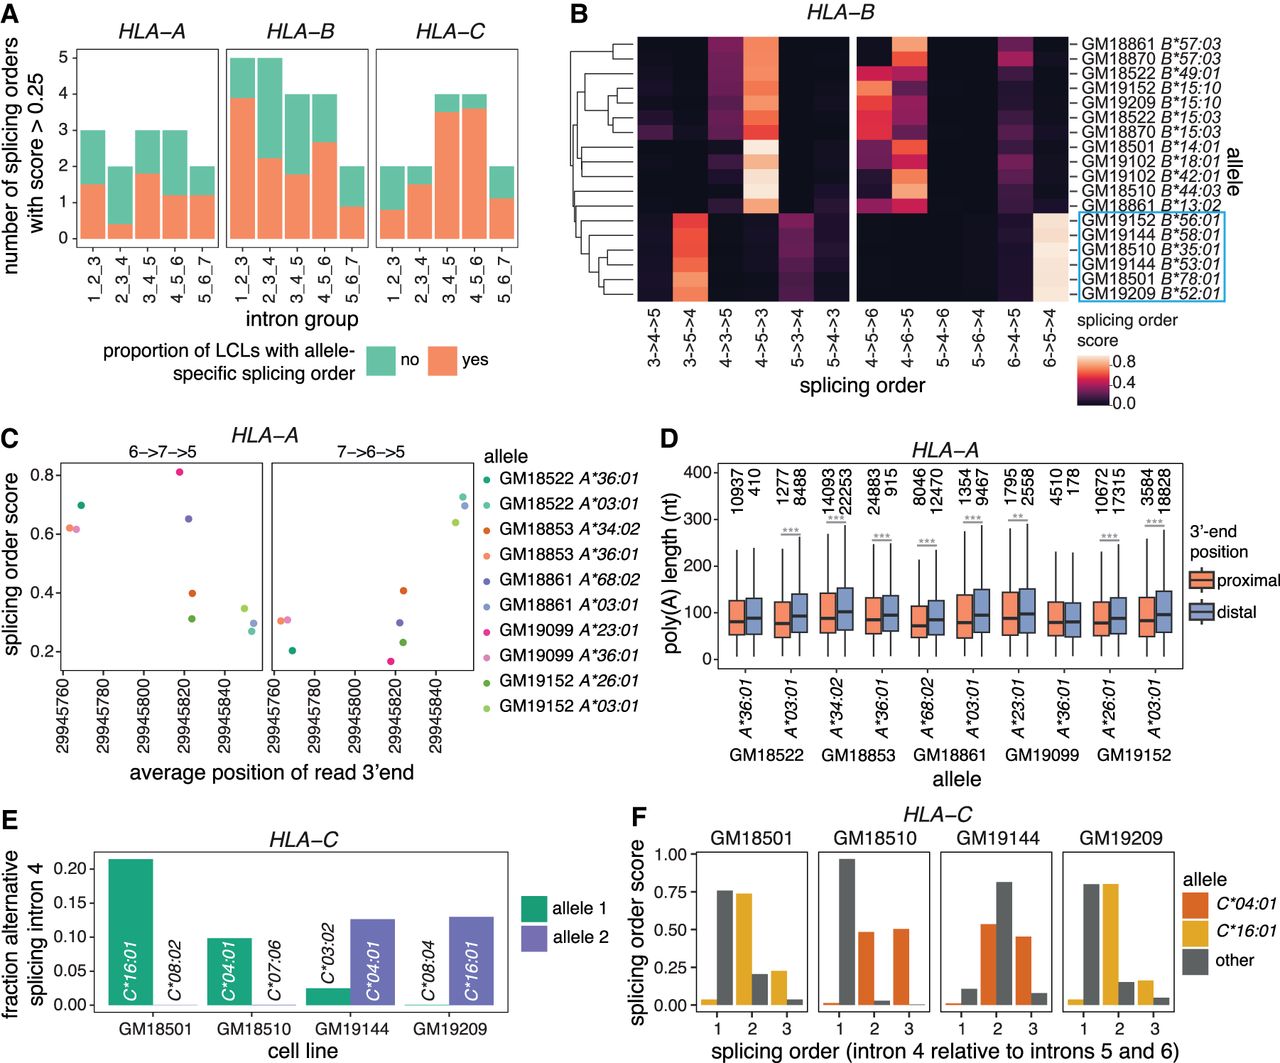
Multilayered regulation of nascent HLA class I transcripts. (A) Number of splicing orders observed across LCLs for each intron group in HLA class I genes. Each bar is colored based on the proportion of LCLs showing allele-specific splicing order for that intron group. (B) Heatmap representing splicing orders for introns 3–5 and 4–6 in HLA-B across LCLs. Each line shows one allele and each column shows one possible splicing order. The squares are colored based on the splicing order score. Alleles were clustered based on their genotypes across the HLA-B gene, so genetically similar alleles are located close to one another. The blue box highlights alleles that have delayed removal of intron 4 relative to other alleles. (C) Splicing order scores as a function of average genomic read 3′-end position in HLA-A. Each dot represents one allele. The splicing order is shown at the top of each plot, with intron numbers separated by arrows. (D) Poly(A) tail length distribution of HLA-A reads separated by allele, based on whether the read ends near the proximal or the distal 3′-end site. Poly(A) tail lengths were compared using a two-sided Wilcoxon rank-sum test. (***) P-value < 0.001, (**) P-value < 0.01. (E) Fraction of reads showing alternative excision of intron 4 in HLA-C, corresponding to exon 5 skipping. (F) Splicing order score as a function of the position of intron 4 in each possible splicing order (removed first, second, or third). The alleles for which there is AS of intron 4 in (E) (HLA-C*04:01 and *16:01) show delayed removal of this intron relative to the other allele.


