
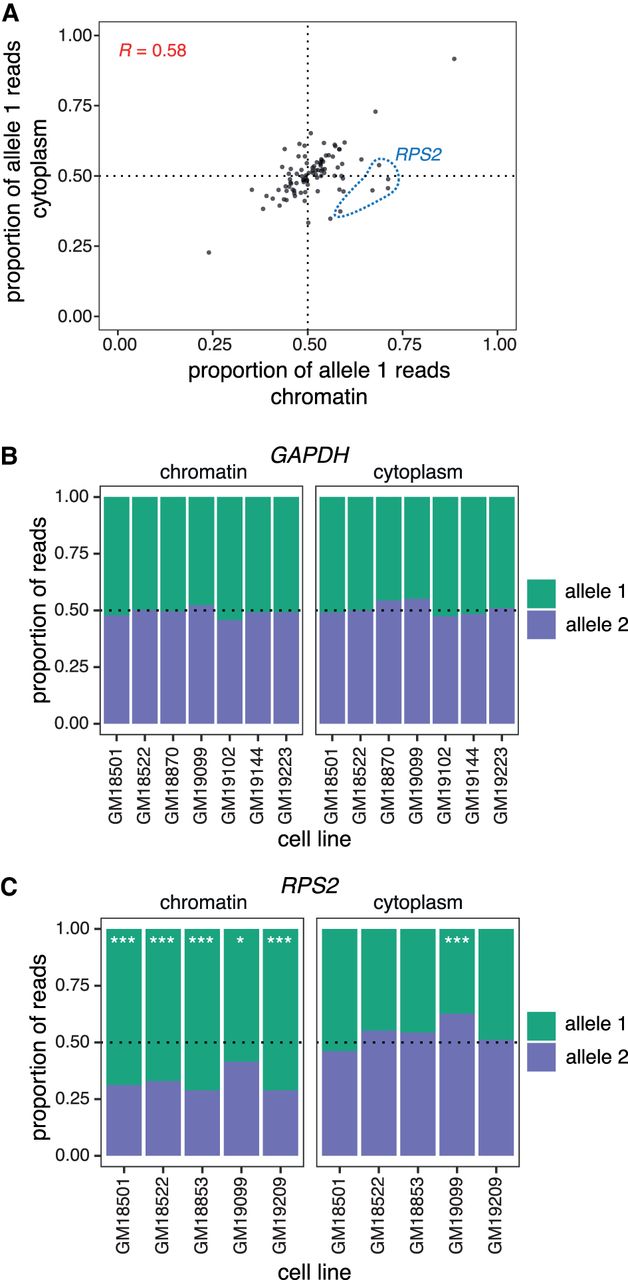
Splicing order changes do not alter cytoplasmic mRNA abundance. (A) Correlation in allele-specific mRNA abundance between chromatin and cytoplasm for intron groups that showed significant allele-specific splicing orders. The proportion of allele 1 reads divided by the total number of reads for alleles 1 and 2 is shown for each subcellular compartment. Each dot represents one gene in one LCL. RPS2 is highlighted in blue dotted circles for the five LCLs that showed splicing order changes in this gene and that are displayed in Figure 2B. (B) and (C) Proportion of (B) GAPDH (B) or (C) RPS2 reads mapping to each allele in chromatin and cytoplasm. The number of reads mapping to each allele on chromatin-associated or cytoplasmic RNA was compared using Qllelic (Mendelevich et al. 2021) or a two-sided binomial test, respectively. (***) P-value < 0.001 and proportion of allele 1 reads <0.4 or >0.6; (*) P-value < 0.01 and proportion of allele 1 reads <0.45 or >0.55.


