
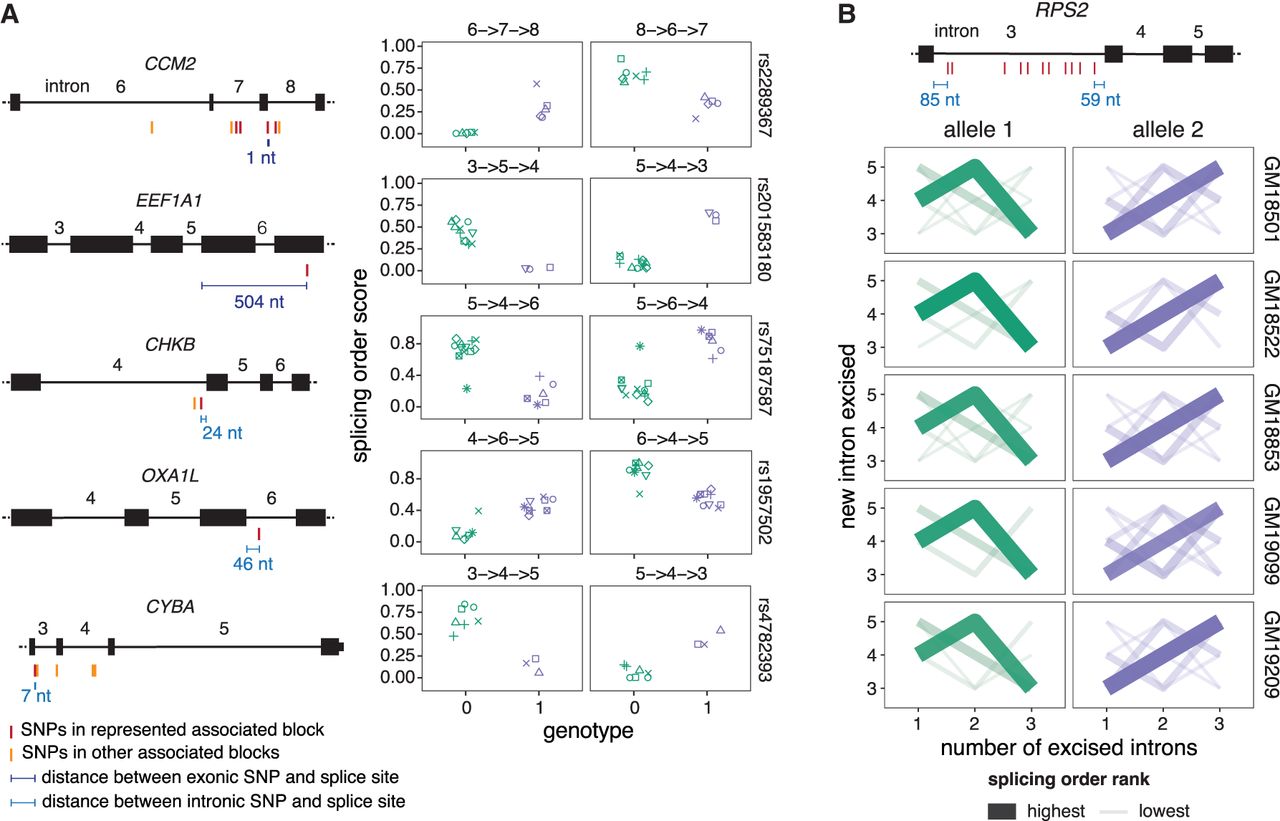
Splicing order changes are associated with specific genetic variants. (A, Left) Schematic representation of each gene, with exons as rectangles and introns as horizontal lines. SNPs represented in the right plots and other SNPs in the same haplotype blocks are depicted in red, while SNPs that are significantly associated with splicing order of the same intron group but in a different haplotype block are shown in light orange. The distance between the SNPs represented in the right plots and the closest splice site are depicted in blue. (Right) Examples of splicing orders in five genes that are significantly associated with the genotypes of the indicated SNPs. Each point represents one allele and the identity of the splicing order is shown at the top of each plot, with intron numbers separated by arrows. Each LCL is displayed in a different shape. (B) Splicing order plot showing allele-specific splicing orders for introns 3–5 of RPS2 in five LCLs. The thickness and opacity of the lines are proportional to the frequency at which each splicing order is used, with the top-ranked order per intron group set to the maximum thickness and opacity. The gene structure is shown at the top, with exons as rectangles, introns as lines, and associated SNPs as in (A).


