
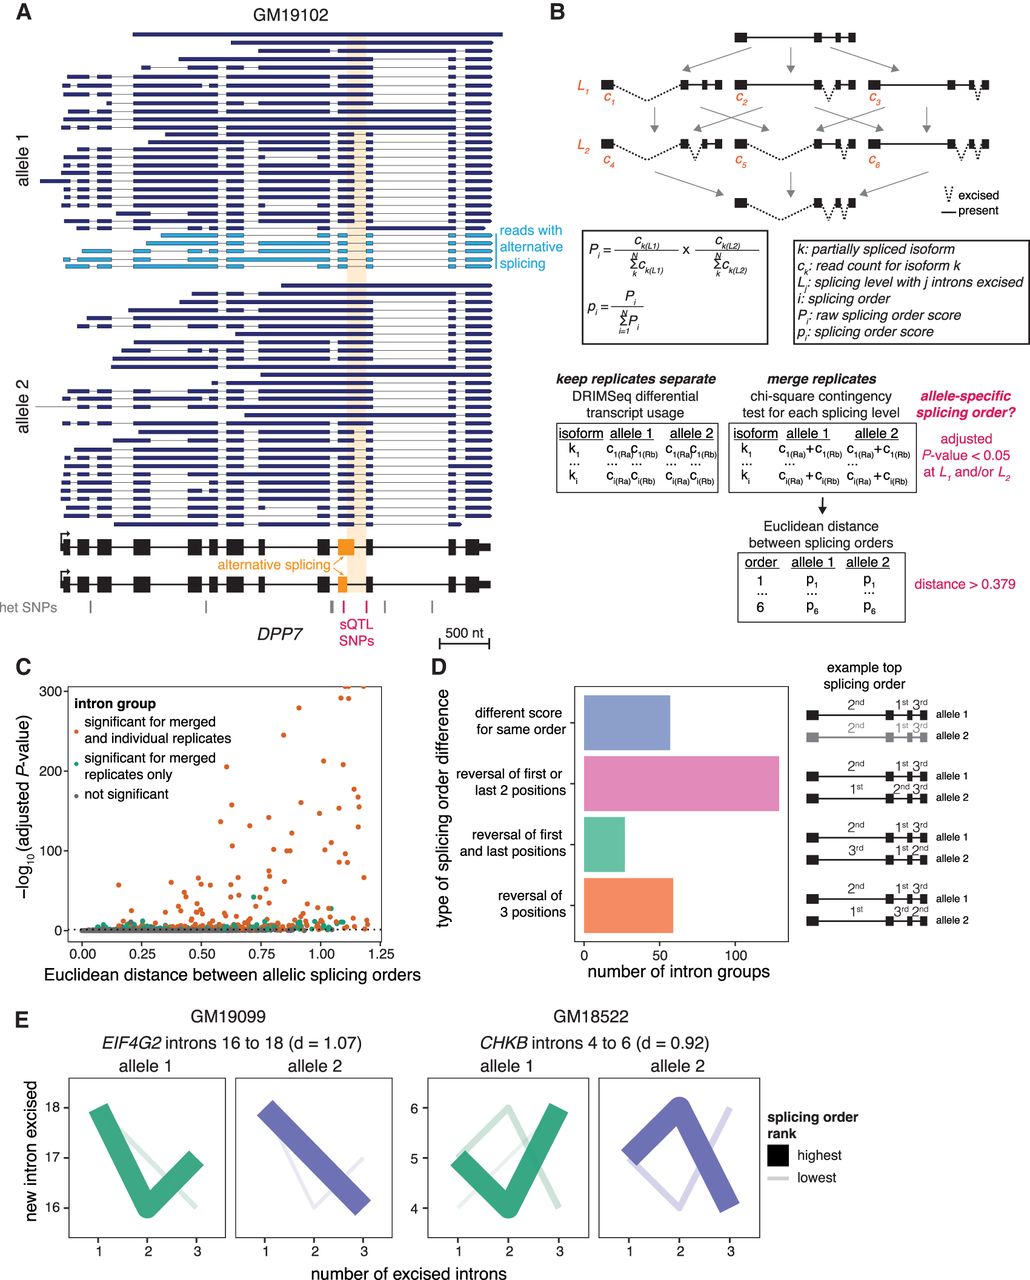
Subcellular dnRNA-seq reveals allele-specific splicing orders. (A) Example of allele-specific splicing in DPP7 in chromatin-associated RNA from LCL GM19102. Ten percent of reads mapping to each allele were randomly sampled. The gene structure is shown at the bottom, with exons as rectangles and introns as horizontal lines. The arrow represents the transcription start site. Each dark or light blue arrow represents one read, with light blue reads highlighting AS of the orange exon. The alternative intron is shaded in orange and reads are sorted based on the excision status of this intron. Heterozygous SNPs in LCL GM19102 are shown as vertical bars below the gene, with dark pink bars representing previously identified sQTL SNPs. (B) Schematic of splicing order computation for groups of three introns. Each intermediate isoform k at splicing levels 1 (one intron excised, L1) and 2 (two introns excised, L2) is depicted. The associated read counts ck are used to calculate splicing order scores for each of the six possible orders. The DRIMSeq differential transcript usage is used to test for differential splicing order using individual replicates (Ra, Rb), while allelic splicing orders from merged replicates are compared using a χ2 contingency test and the Euclidean distance between orders. (C) Volcano plot showing the results of allele-specific splicing order analysis from merged replicates. Each dot represents one intron group. Intron groups that showed a significant difference in the analyses with individual replicates and merged replicates are shown in orange. (D) Type of splicing order difference as a function of the Euclidean distance between allelic splicing orders. The different categories are schematized on the right, with the number representing the order in which each intron is removed, and are defined in more detail in the Methods. The transcript in gray has a lower top splicing order score than the ones in black. (E) Splicing order plots showing allele-specific splicing orders for two example intron groups. The thickness and opacity of the lines are proportional to the frequency at which each splicing order is used, with the top-ranked order per intron group set to the maximum thickness and opacity. d indicates the Euclidean distance between alleles.


