
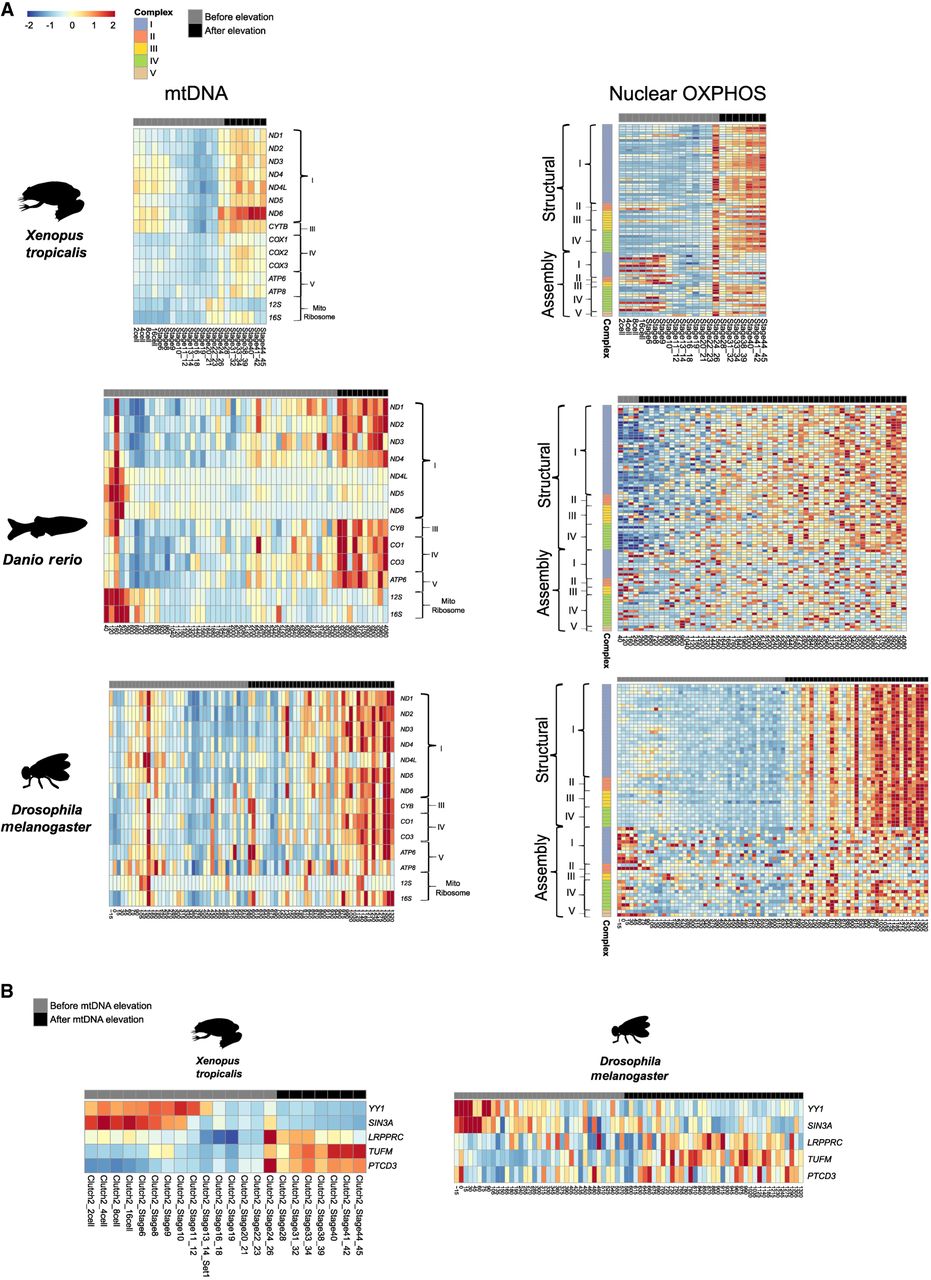
Mitonuclear gene expression is elevated during prenatal development. (A) Heatmaps of mtDNA and nuclear DNA–encoded OXPHOS gene expression from X. tropicalis, C. elegans, D. melanogaster, and D. rerio. The color bar indicates the scaled expression. Red scale indicates elevated expression; blue scale, reduced expression. The x-axis indicates prenatal samples; y-axis, mtDNA/OXPHOS genes. Notice division into OXPHOS complexes and into structural and assembly genes of the OXPHOS. (B) Heatmap representing log2FC values of regulatory factors and genes related to mitochondrial biogenesis. The color bar indicates the log2FC. The x-axis indicates organisms; y-axis, genes. Only log2FC > 0.2 and log2FC < −0.02 are shown.


