
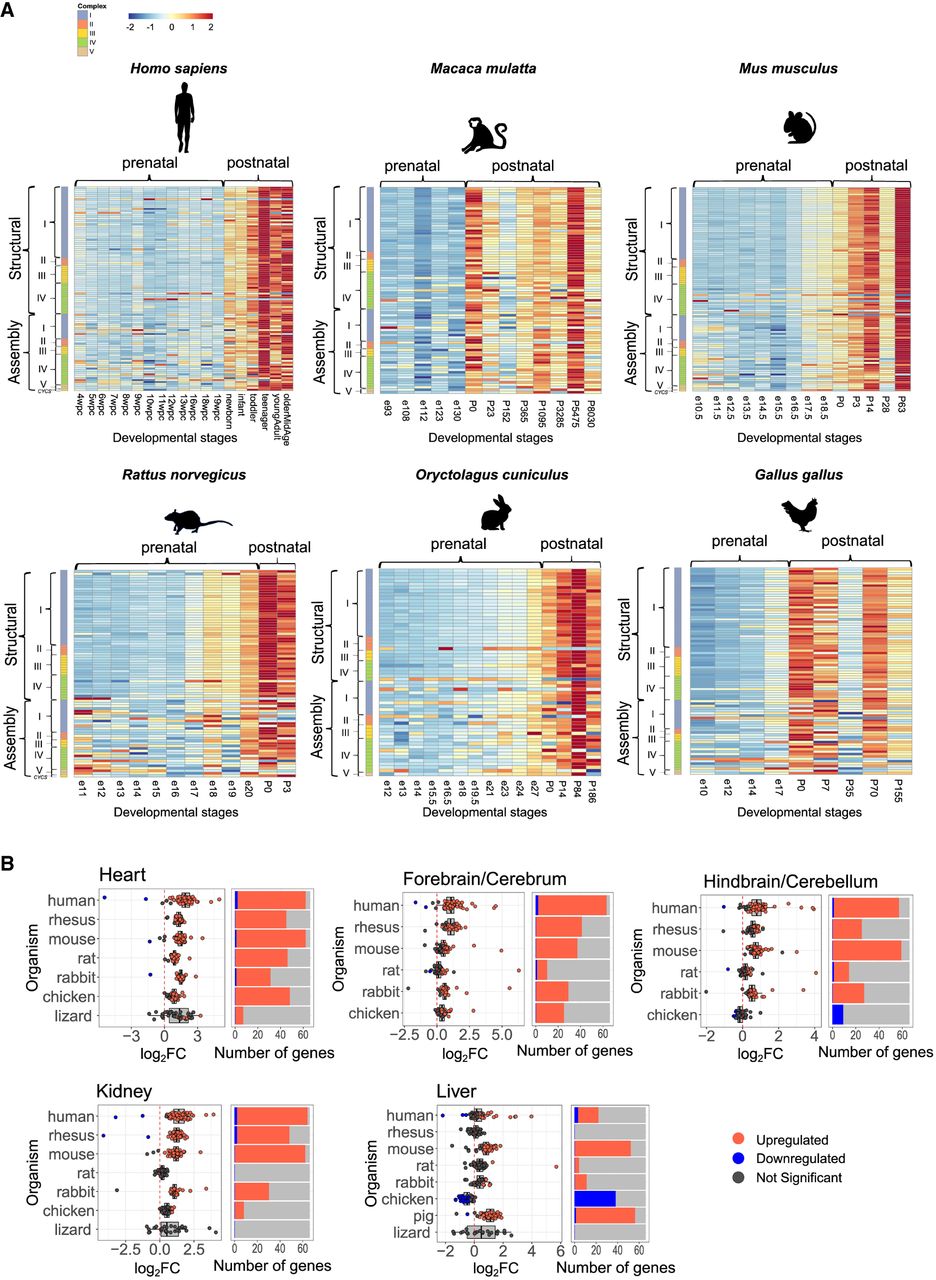
Nuclear DNA-encoded OXPHOS genes expression is elevated after birth/hatching across vertebrates. (A) Heatmaps representing expression of nuclear DNA-encoded OXPHOS gene in the heart from five mammals and in birds. Color bar: red scale indicates elevated expression; blue scale, reduced expression. Above each panel are the labels of the prenatal and postnatal samples. The x-axis indicates developmental stages; y-axis, nuclear DNA-encoded genes, divided according to OXPHOS complexes, structural and assembly genes, and Cytochrome C (CYCS). (B, left) Box plots indicating the log2FC of nuclear DNA-encoded structural subunits of the OXPHOS. The x-axis indicates Log2FC; y-axis, the tested organisms. Color bar: blue dots indicate downregulation (log2FC < −0.2, P-value < 0.05); red dots, upregulation (log2FC > 0.2, P-value < 0.05); and gray dots, nonsignificant. Dashed vertical red line displays the value of zero log2FC on the x-axis. (Right) Bar plots representing the number of significant (indicated in red or blue) and nonsignificant (NS) nuclear OXPHOS genes expression (colored in gray). Blue indicates statistically significant genes with decreased expression between the time points (P < 0.05); red, number of genes with significantly increased expression. The x-axis indicates number of genes; y-axis, organisms.


