
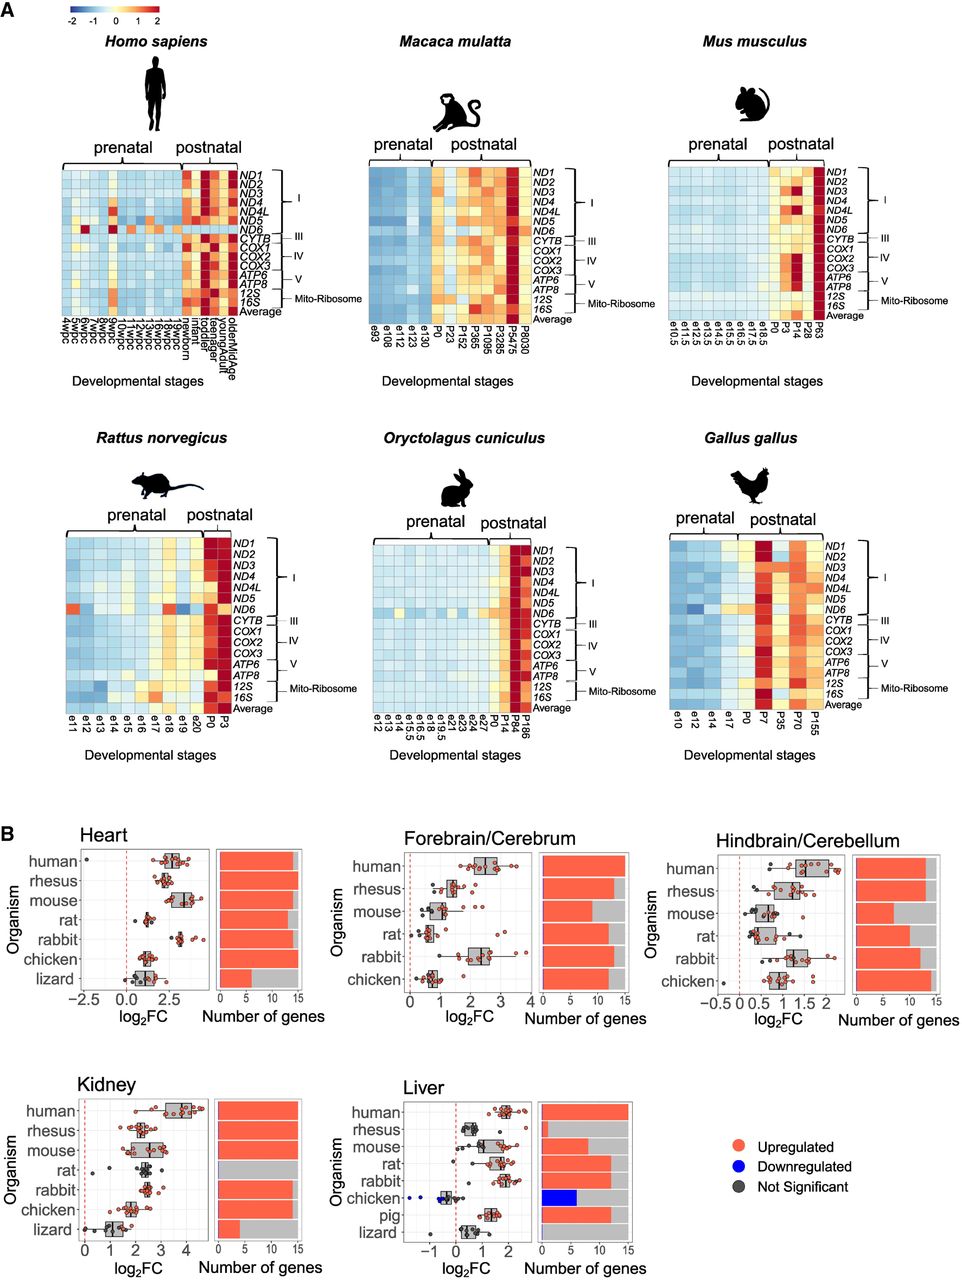
mtDNA gene expression is elevated in postnatal vertebrate samples. (A) Heatmaps representing mtDNA gene expression in heart from five mammals and in the chicken. Color bar indicates the scaled expression. Red scale indicates elevated expression; blue scale, reduced expression. The x-axis indicates prenatal and postnatal stages of sample collection; y-axis, mtDNA genes and their OXPHOS complex assignments. (B, left) Box plots indicating the log2FC of mtDNA genes. The x-axis indicates Log2FC; y-axis, the tested organisms: H. sapiens, human; M. mulatta, rhesus; M. musculus, mouse; R. norvegicus, rat; O. cuniculus, rabbit; G. gallus, chicken; Sus scroffa, pig; and A. carolinensis, lizard. Color bar: blue dots indicate downregulation (log2FC < −0.2, P-value < 0.05); red dots, upregulation (log2FC > 0.2, P-value < 0.05); and gray dots, nonsignificant. Dashed vertical red line displays the value of zero log2FC on x-axis. (Right) Bar plots representing the number of significant (indicated in red or blue) and nonsignificant (NS) mtDNA genes expression (colored in gray). Blue indicates statistically significant genes with decreased expression between the time points (P < 0.05); red, number of genes with significantly increased expression. The x-axis indicates number of genes; y-axis, tested organisms.


