
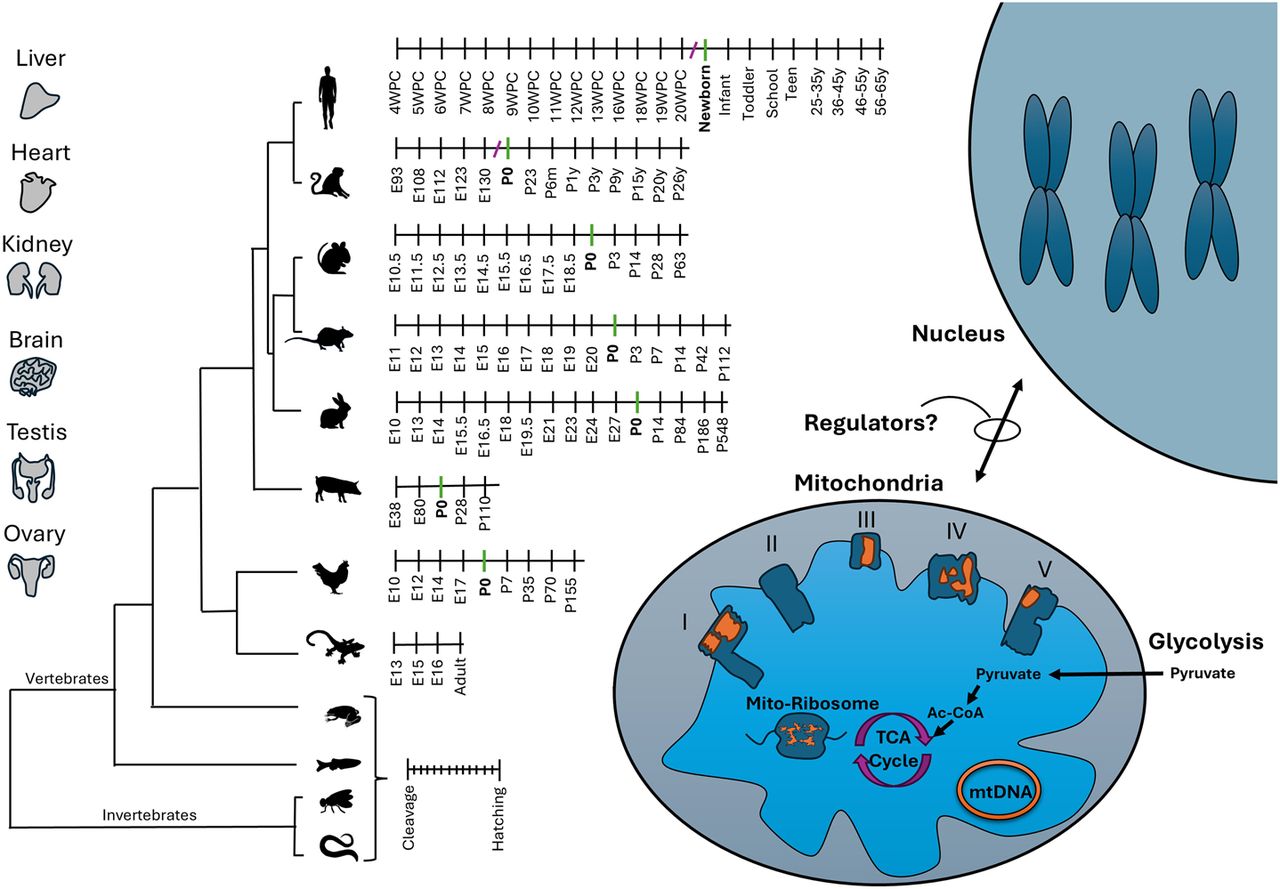
Roadmap to assessment of mitonuclear gene expression (RNA-seq) during the course of development and evolution. Tissues analyzed (indicated) were collected from six mammals (Homo sapiens, Macaca mulatta, Mus musculus, Rattus norvegicus, Oryctolagus cuniculus), as well as from Gallus gallus (chicken), during development. The developmental stages are indicated per organism, and P0 (birth/hatching) is highlighted for mammals and birds. Missing stages (owing to lack of samples) are indicated by “/.” To avoid sample size issues, gene expression in Anolis carolinensis (brain, heart, kidney, liver) was compared between a group of embryonic versus adult samples (e.g., not divided into further stages). Analysis of additional nonmammalian vertebrates, for example, Xenopus tropicalis (tropical frog) and Danio rerio (zebrafish), as well as two invertebrates, for example, Drosophila melanogaster and Caenorhabditis elegans, was limited to the prenatal stages. mtDNA and nuclear DNA–encoded subunits of OXPHOS complexes I, III, IV, and V are indicated in orange and dark blue, respectively. Additional selected metabolic pathways are indicated, including the mitochondrial ribosome (mito-ribosome), tricarboxylic acid cycle (TCA), and glycolysis. The lack of knowledge of regulators of mitonuclear gene expression is indicated.


