
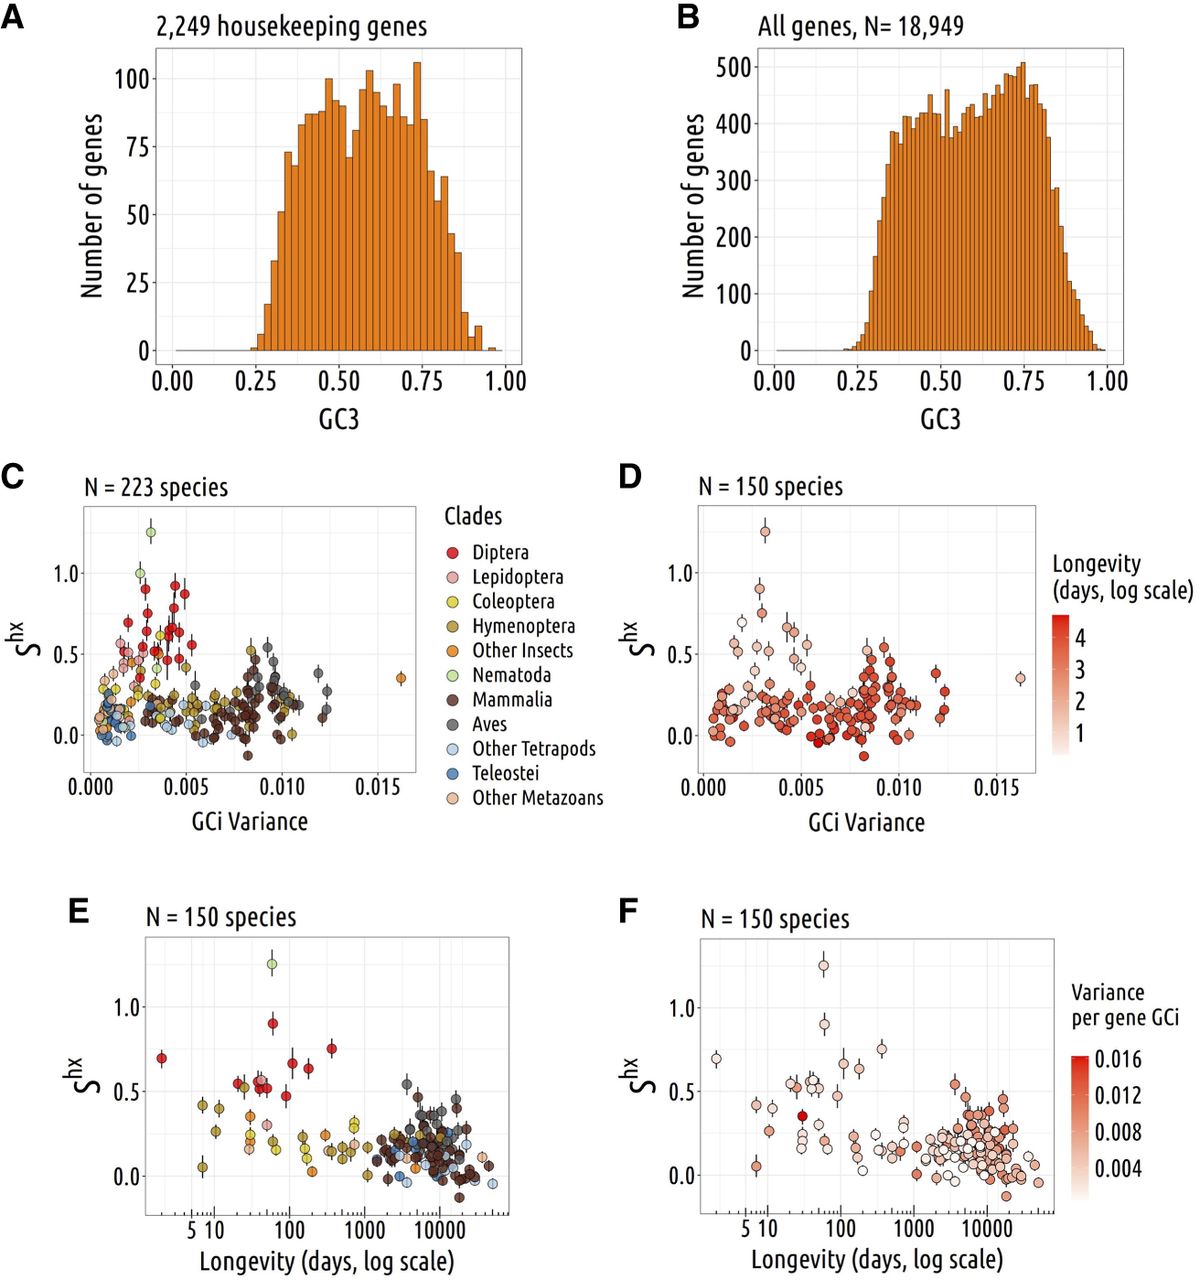
Figure 7.
Impact of intra-genomic variability in neutral substitution patterns on TS. (A) Distribution of GC3 across human housekeeping genes (identified based on gene expression data from 27 healthy tissues, extracted from Pouyet et al. 2017). (B) Distribution of GC content at the third position of codons (GC3) across all human genes. (C,D) Relation between TS intensity Shx and the gene GCi variance. (D) Species are colored with a longevity gradient (log scale). (E,F) Relation between TS intensity Shx and longevity (days). (F) Species are colored with a GC intron variance gradient (log scale; N = 223 species).


