
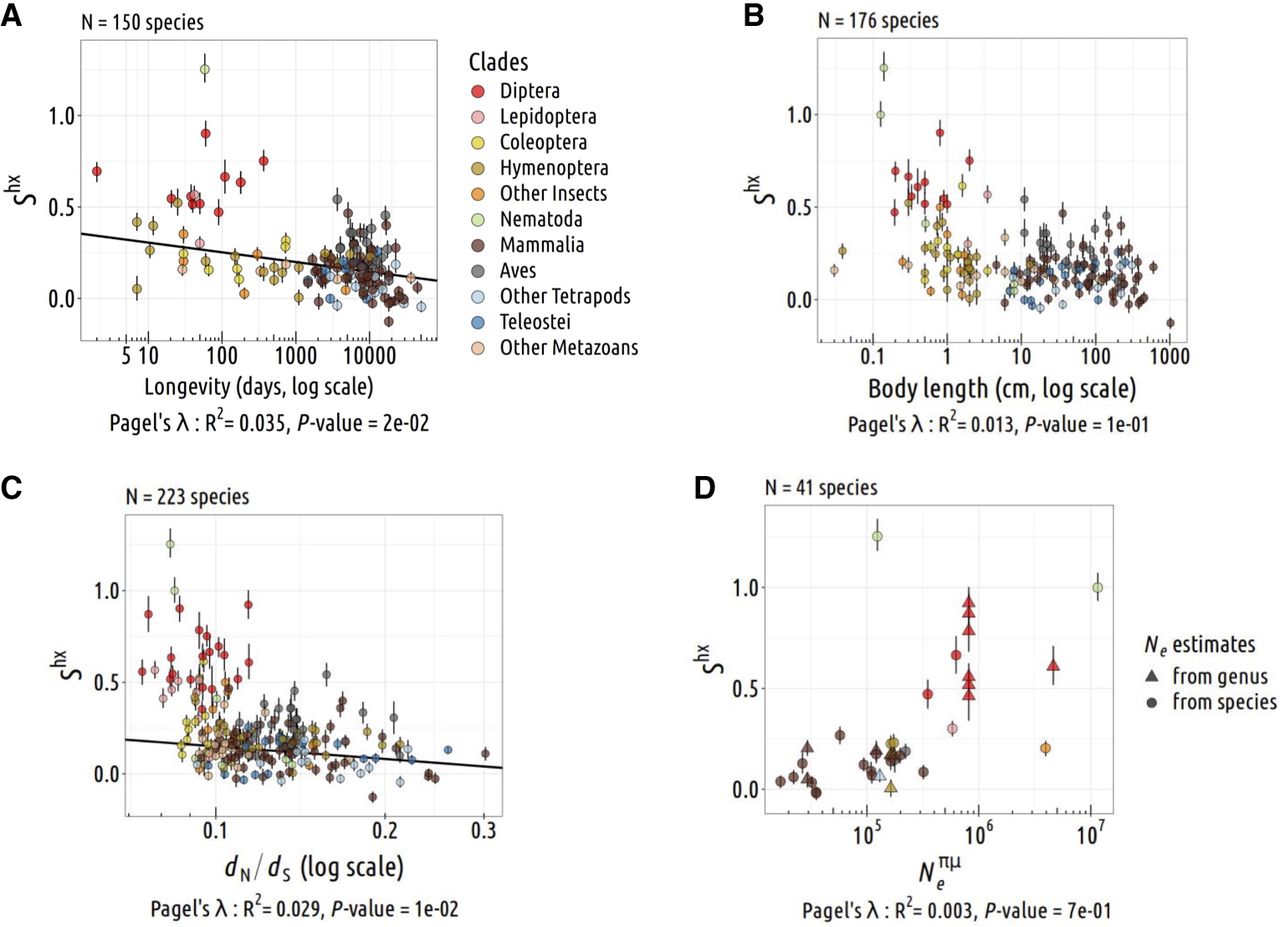
Relationship between Ne and translational selection (TS) intensity. Relationship between the population-scaled selection coefficient (S) and longevity (A), body length (B), dN/dS (C), and  (D; N = 223 species). The TS intensity S is measured on the top 2% most highly expressed genes (Shx). Pagel's lambda model is used to take into account the phylogenetic structure of the data in a regression model (the regression
line is displayed in black when the correlation is significant). Error bars represent the 2.5th and 97.5th percentiles of
Shx values obtained by bootstraping (1000 draws with replacement among the top 2% most highly expressed genes, and the 50% least
expressed).
(D; N = 223 species). The TS intensity S is measured on the top 2% most highly expressed genes (Shx). Pagel's lambda model is used to take into account the phylogenetic structure of the data in a regression model (the regression
line is displayed in black when the correlation is significant). Error bars represent the 2.5th and 97.5th percentiles of
Shx values obtained by bootstraping (1000 draws with replacement among the top 2% most highly expressed genes, and the 50% least
expressed).


