
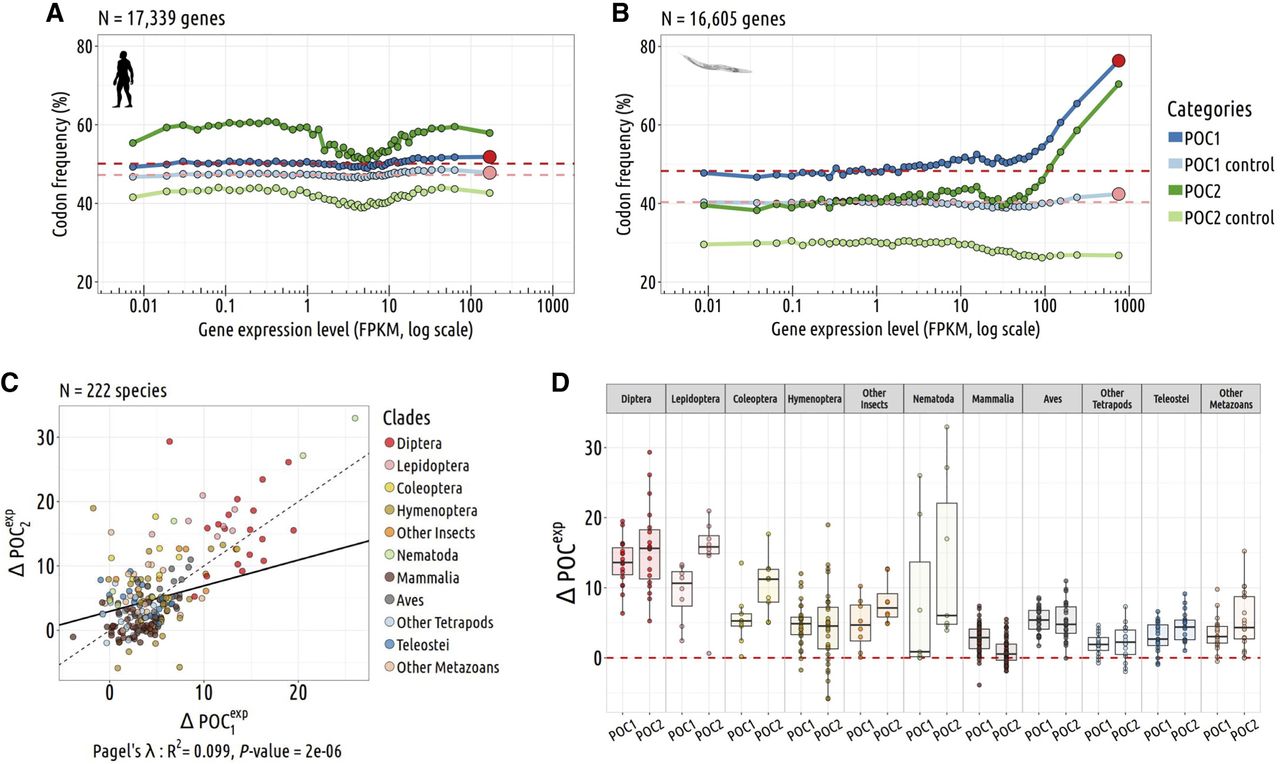
Relationship between the frequency of putative-optimal codons and gene expression level. (A,B) Variation in the proportion of POC within coding sequences (POC1, dark blue; POC2, dark green) according to gene expression
level. To control for variations in neutral substitution patterns, we analyzed the frequency of corresponding triplets within
introns (POC1 control, light blue; POC2 control, light green). Each point represents a 2% bin of genes, with the red point
at the end of each POC1 curve denoting the 2% most highly expressed genes. The red lines indicate the average POC1 frequency
observed in the 50% least-expressed genes (FPKM). The difference in POC frequency between the top 2% most highly expressed
genes and the 50% least-expressed genes is noted ΔPOCexp. A represents H. sapiens, and B represents C. elegans. (C) Correlation between  and
and  . (D) ΔPOCexp distributions per species and by clades for the POC1 and POC2 (N = 223 species).


