
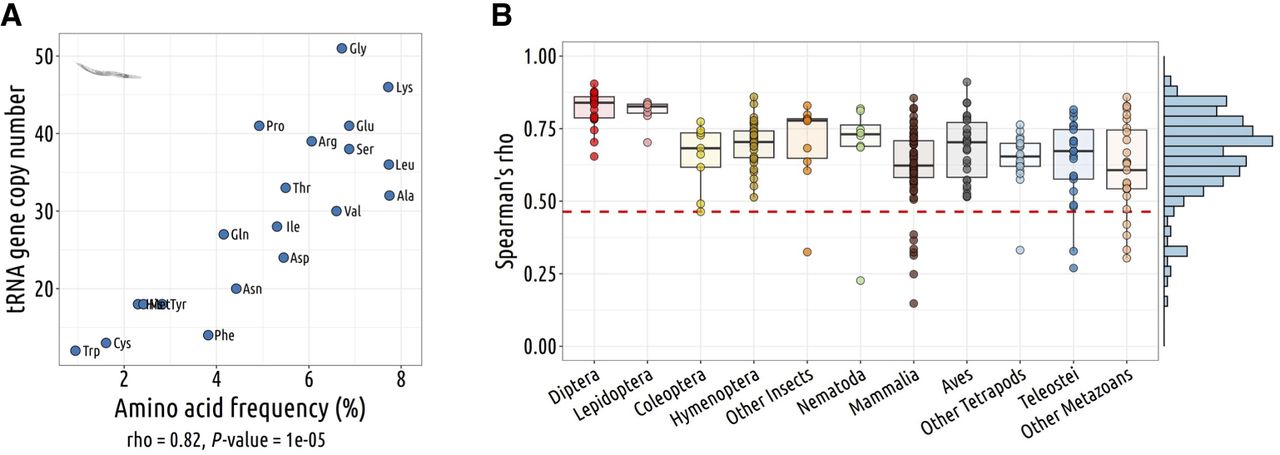
Figure 2.
The tRNA gene copy number is a good predictor of the codon demand. (A) Representative example of the relationship between the number of isoacceptor tRNA gene copy per amino acid and the frequency of amino acid weighted by gene expression in C. elegans. Spearman's rho and corresponding P-value are displayed under the graph. (B) Boxplot showing the distribution of Spearman's correlation coefficients (ρ) from A for each species (N = 246 species). The red line indicates the threshold above which the P-value is lower than 0.05.


