
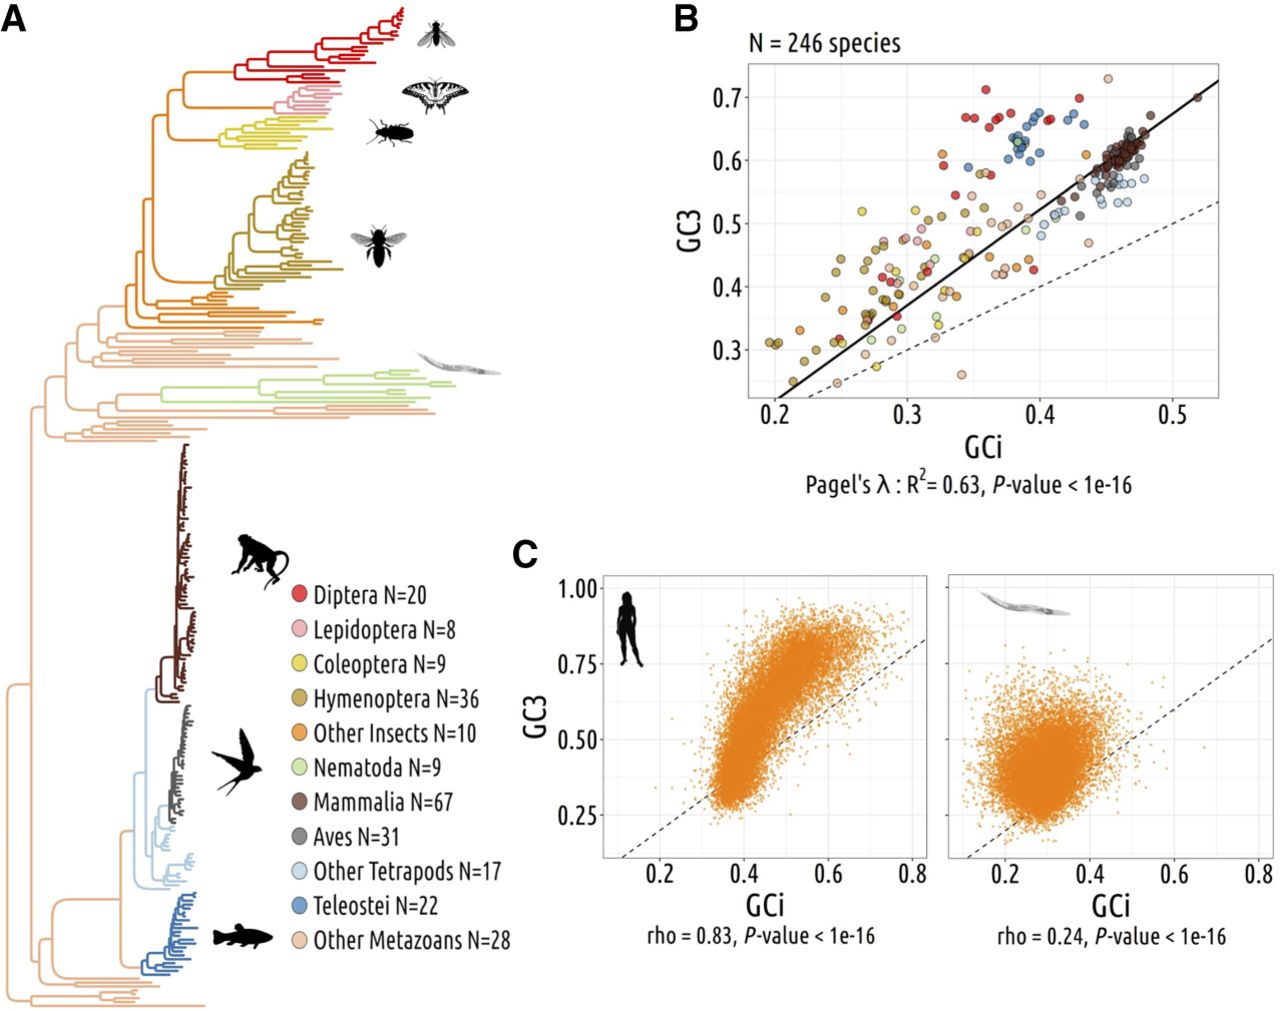
Figure 1.
Codon usage variations are driven by nonadaptive processes. (A) Phylogenetic tree of the 257 studied species. (B) Gene average GC content at the third position of codons (GC3) and the gene average GC in introns (GCi) for each species. Pagel's lambda model is used to take into account the phylogenetic structure of the data in a regression model (black line). (C) Correlation between GC3 and GCi in Homo sapiens (left) and in Caenorhabditis elegans (right); each point corresponds to one gene. Spearman's rho and corresponding P-values are displayed under the graph. The dotted lines correspond to x = y.


