
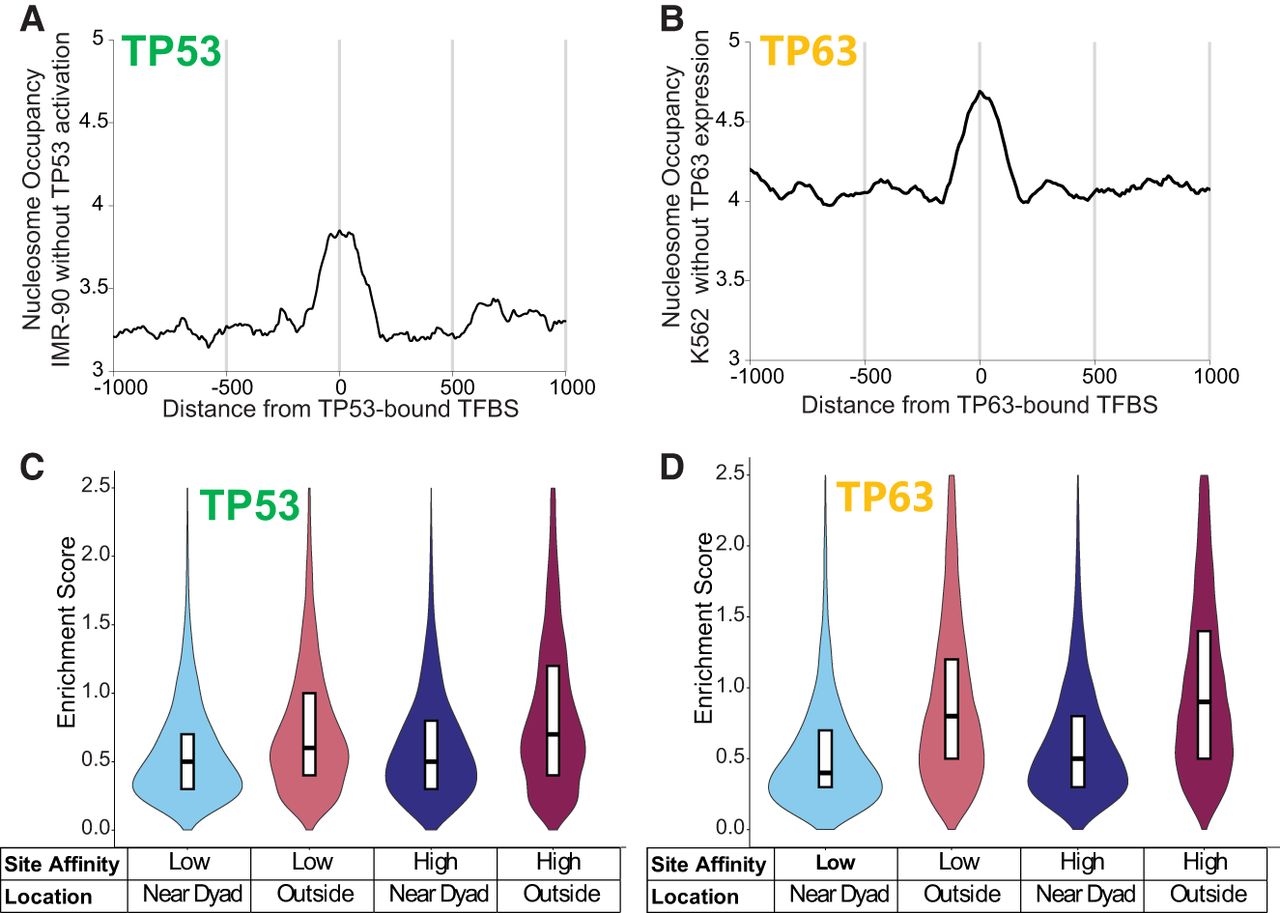
TP53 and TP63 enrichment relative to nucleosome positioning and binding-site affinity. (A) Average nucleosome occupancy at TP53 binding sites before activation with Nutlin in IMR-90 cells, as determined from MNase-seq data. These sites represent the locations where TP53 binds following its activation. (B) Average nucleosome occupancy at TP63 binding sites before expression in K562 cells, as determined from MNase-seq data. These sites correspond to the locations where TP63 binds upon expression. (C,D) Violin plots of TP53 and TP63 ChIP-seq peak enrichment scores, categorized by binding-site affinity and nucleosome position (lower/higher-affinity, near-dyad/outer nucleosome). Binding sites were identified using the MA0106.3 TP53 motif (JASPAR), and nucleosome positioning was determined from MNase-seq data.


