
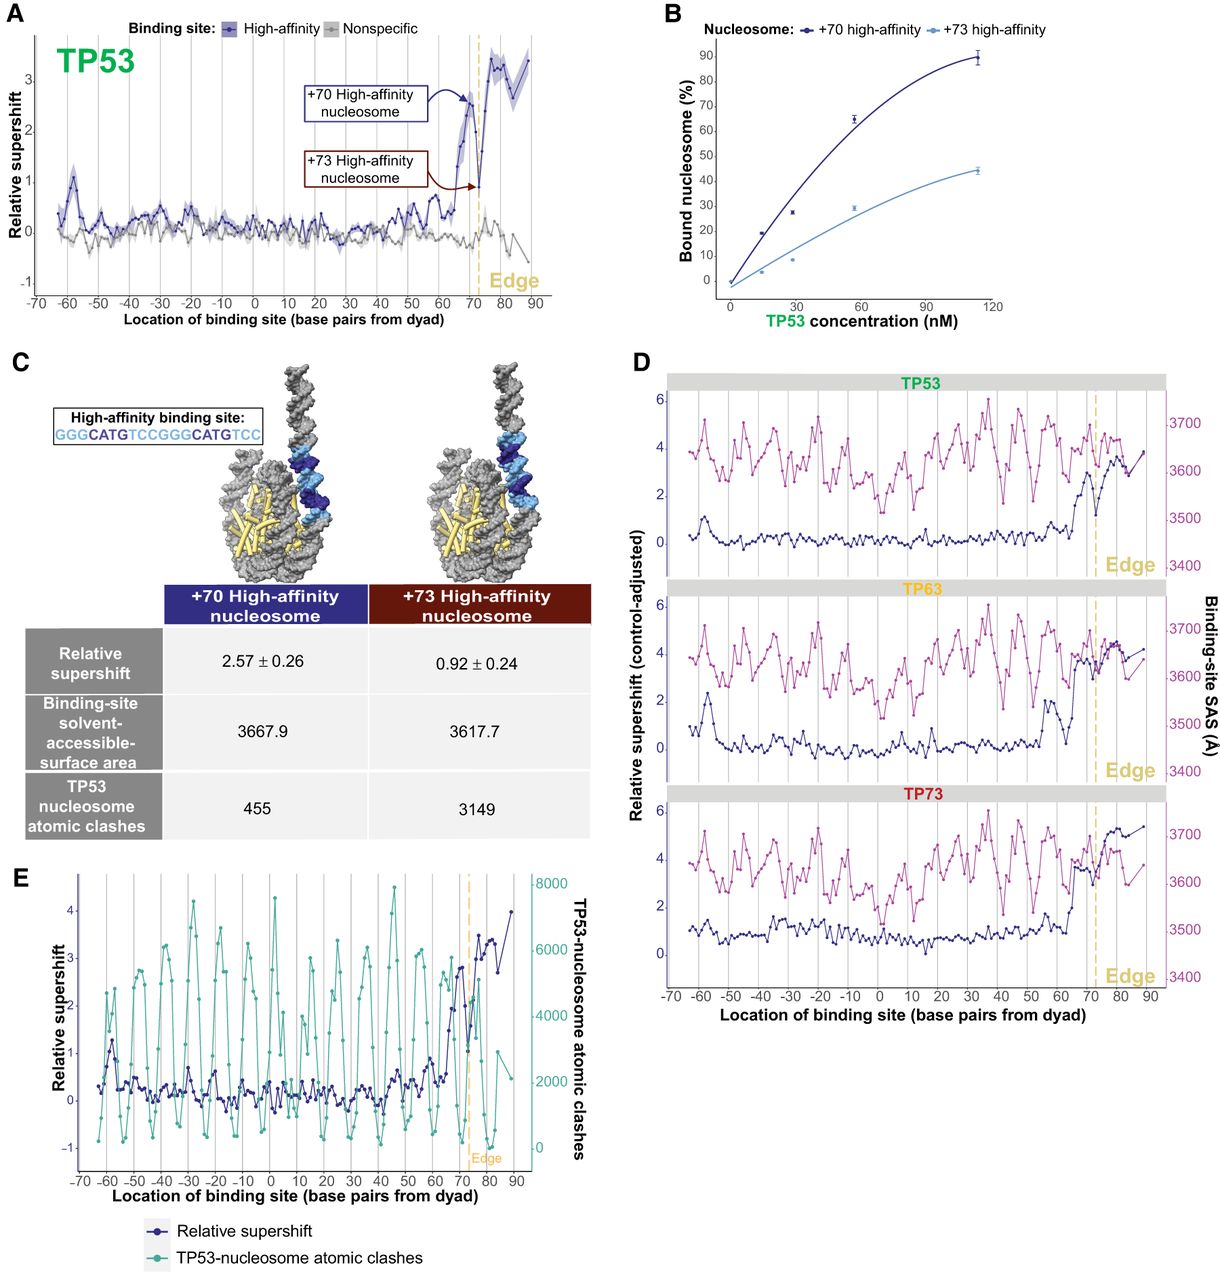
Binding site helical orientation in nucleosomal DNA impacts TP53 family–nucleosome binding. (A) TP53 binding to a high-affinity (HA) TP53 family binding site at different nucleosomal positions, measured relative to nonspecific binding sites and represented by relative-supershift values (Equation 1). A nonspecific motif for STAT5A is shown for comparison in gray. (Edge) The right end of the 146 bp nucleosome core particle. Shading indicates SEM. n = 3. (B) Binding affinity comparison between +70 and +73 high-affinity nucleosomes—both of which are indicated in A. (C) Illustrative models of the +70 and +73 high-affinity nucleosomes. The TP53-relative-supershift value corresponding to each nucleosome is shown. Also shown are the solvent-accessible-surface area of the conserved CATG bases of the high-affinity binding site in each nucleosome and the number of atomic clashes between the TP53 tetramer and nucleosome. (D) TP53 family binding to the HA binding site at different nucleosomal positions is plotted in blue as “control-adjusted” relative-supershift values (i.e., relative-supershift values of nonspecific-binding-site-containing nucleosomes subtracted from relative-supershift values of HA-binding-site-containing nucleosomes). Solvent-accessible surface area (SAS) of the conserved CATG bases of the high-affinity binding site is plotted in purple. (Edge) The right end of the 146 bp nucleosome core particle. (E) Plot of TP53 relative-supershift values versus the number of atomic clashes between a TP53 dimer and the nucleosome at different nucleosomal positions.


