
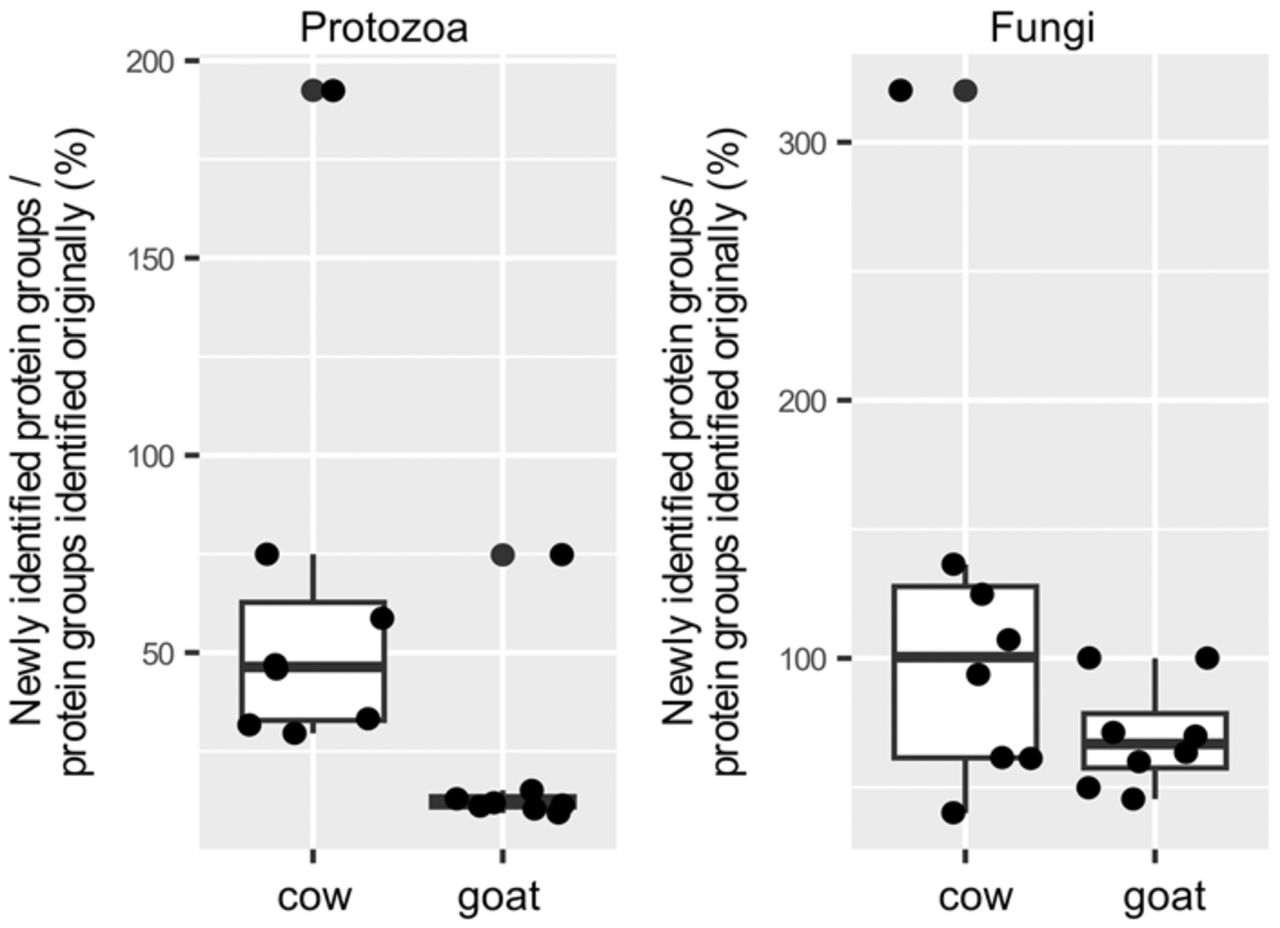
Figure 6.
Increases in the number of rumen protozoal and fungal protein groups identified with the new protein databases compared with the previous rumen proteomic study. The numbers represent the percentage ratio between newly identified protein groups and those identified in the original study. Box plots indicate the median (middle line), the 25th and 75th percentiles (box), as well as individual observations (dots).


