
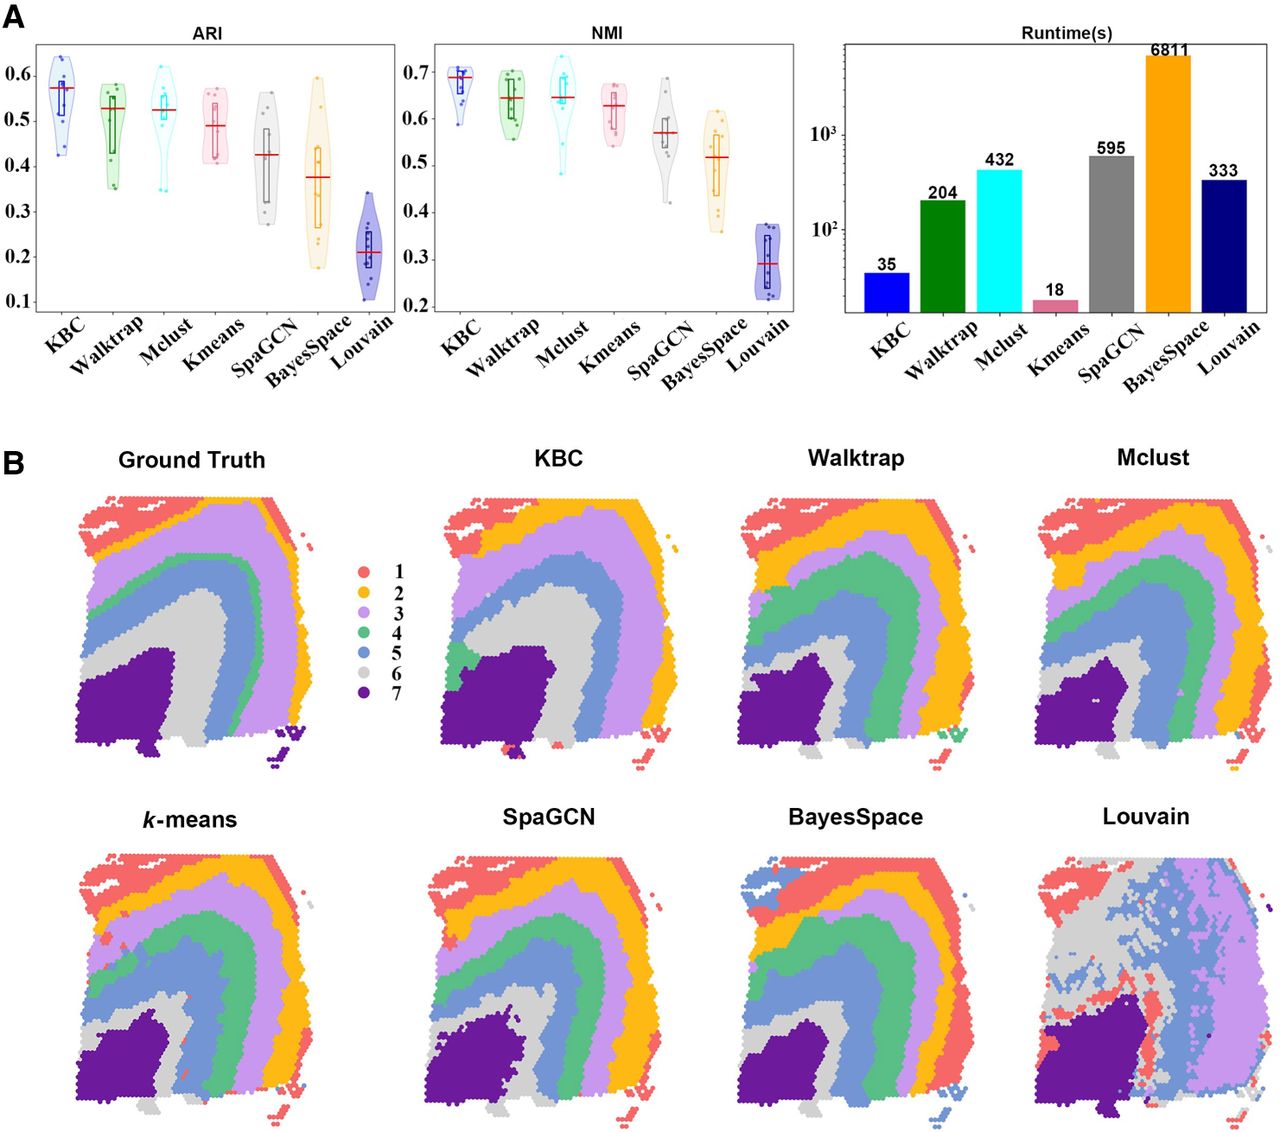
Figure 3.
Second ablation study. Comparing different clustering algorithms using the same SpatialPCA embedding. (A) The violin plots show the ARI and NMI results of all 12 slices of DLPFC of the seven clustering algorithms. The runtimes are showed in a bar chart. (B) The detailed clustering results of different clustering methods are shown for the slice 151673. Only SpaGCN ran on GPU; others ran on CPU.


