
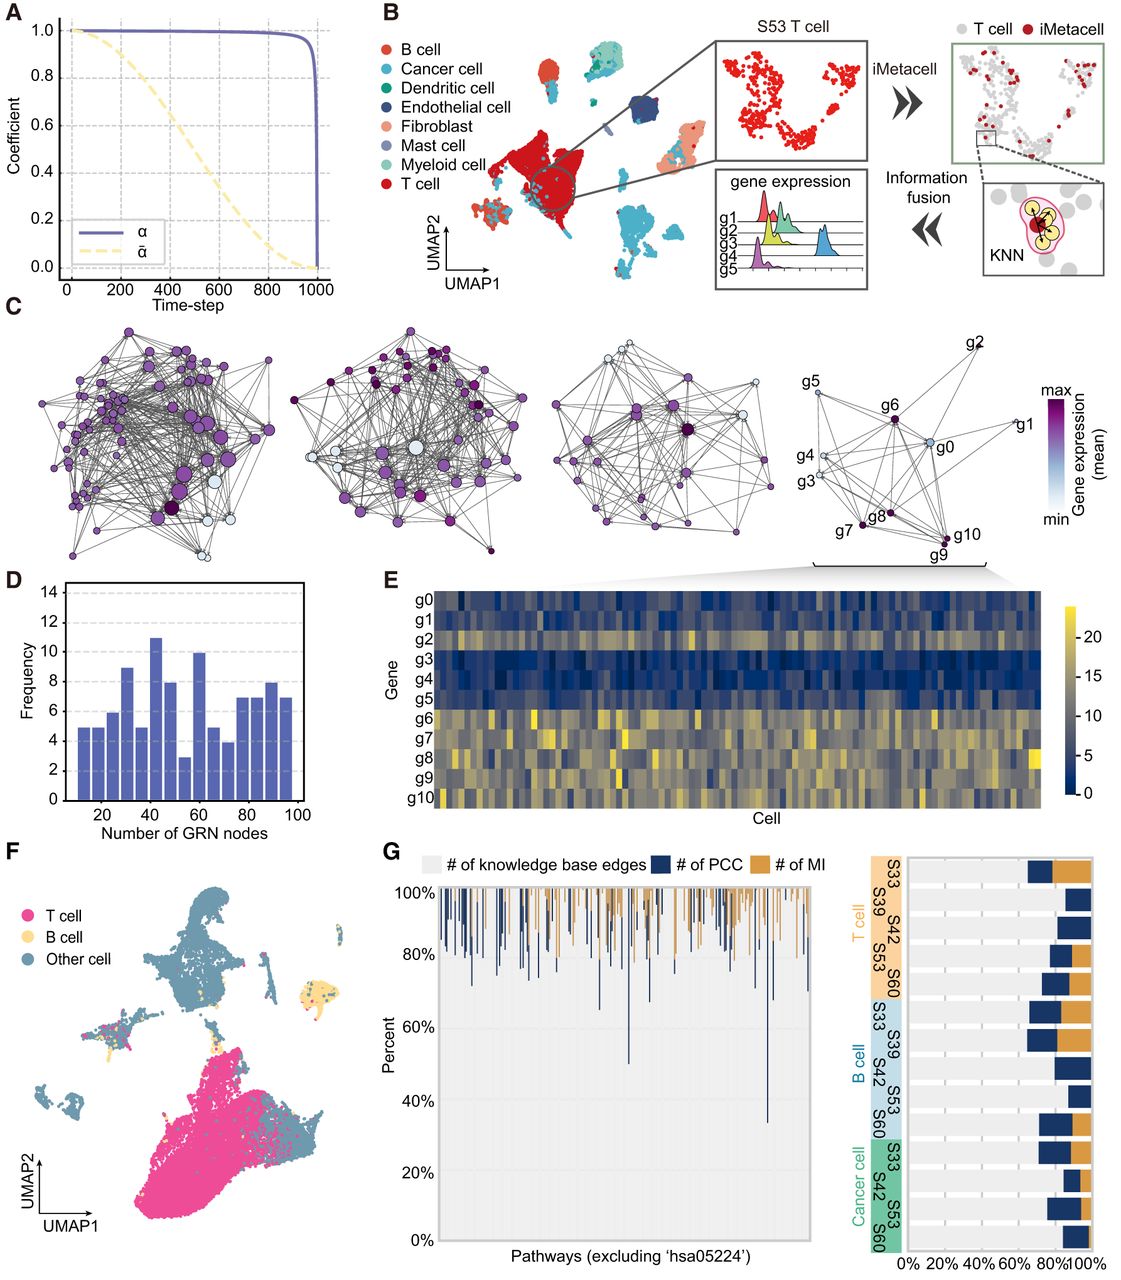
Details of the DigNet method and benchmark data sets. (A) The decay curve of the noise coefficient alpha as the time-step increases within DigNet. (B) Cell UMAP plots of breast cancer patients S33–S60 (left) and the detailed process of constructing iMetacells. (C) Partially synthesized gene network structures (with varying gene numbers of 80, 51, 28, and 11, respectively), with colors indicating their mean gene expression values. (E) Statistics on the number of genes in the synthetic networks. (D) Generating gene expression profiles for networks of different sizes using SERGIO. (F) UMAP of single-cell data for normal and cancerous breast tissues, with merged and labeled distributions of T cells and B cells. (G) Network composition information for a subset of benchmark data used in the DigNet training set (left; the benchmark network for B cells of patient S53). The KEGG breast cancer pathway hsa05224 is used for performance testing (right; the benchmark network for all cells).


