
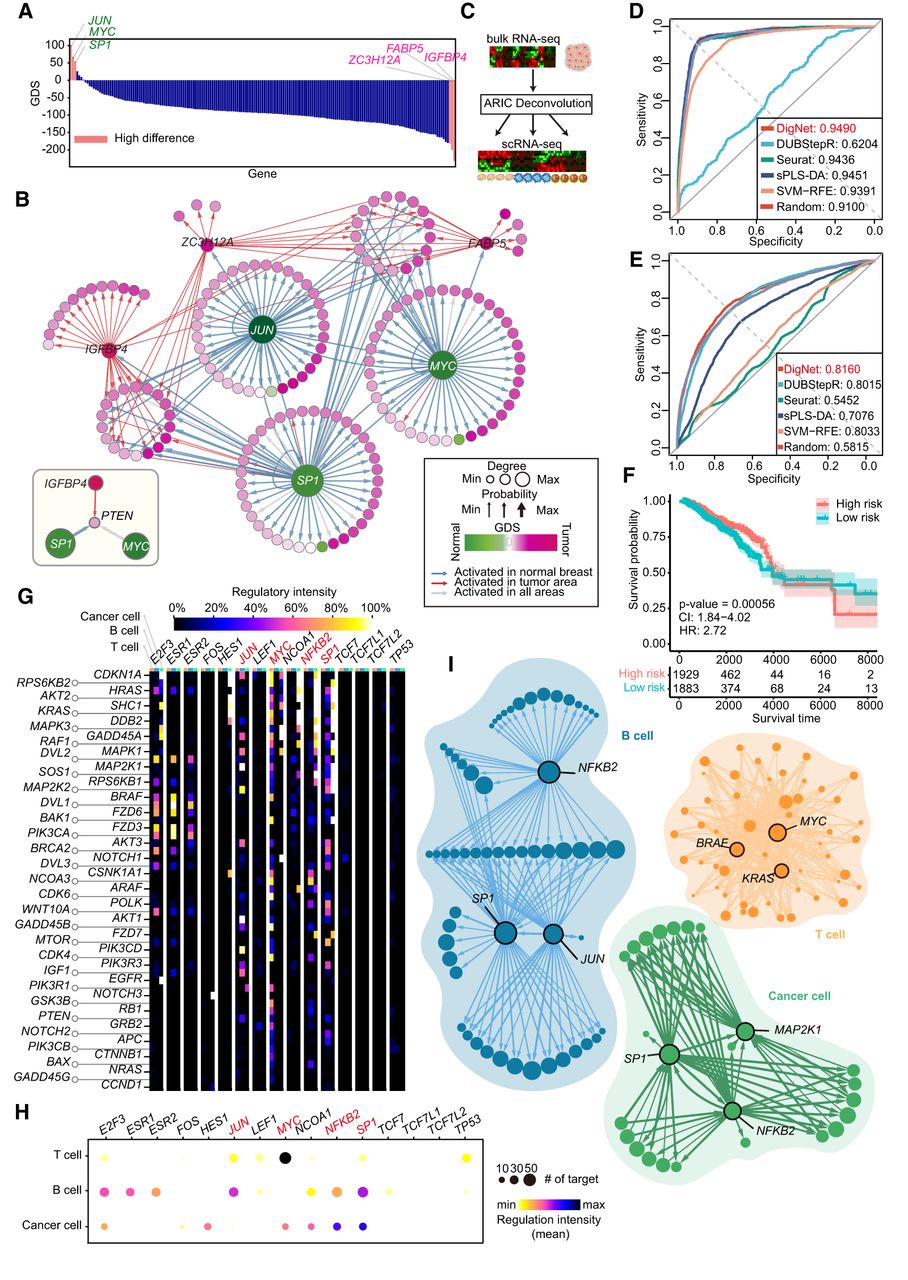
Breast cancer cell–specific GRN reveals key genes and regulatory architectures. (A) Gene differential scores are calculated based on the difference between T cell GRN in normal breast tissue and cancerous samples, highlighting the top three genes with the highest scores. (B) Extraction and analysis of T cell differential gene regulations associated with high differential genes, with a focus on the regulatory heterogeneity of the PTEN gene under normal conditions (bottom left). (C) Schematic illustration of deconvolving TCGA breast cancer bulk RNA-seq data into scRNA-seq data using the ARIC method. (D) Classification AUROC values for the top 10 biomarker genes identified by DigNet and other methods in TCGA BRCA T cells, with optimal values highlighted in red. (E) Classification AUROC values for the top 20 biomarker genes selected by DigNet and alternative methods in normal/cancerous breast T cells. (F) Kaplan–Meier (K-M) curves for the top 10 biomarker genes chosen by DigNet in TCGA breast cancer T cells, analyzed through a multifactorial Cox survival analysis, where CI represents the confidence interval, and HR stands for the hazard ratio. (G) Regulatory landscape of transcription factor (TF)–target gene interactions in T cells, B cells, and cancer cells of patient S53, with regulatory strength inferred from DigNet probability values. (H) Cell type–specific summary of each TF's target genes in subfigure G, where dot size reflects target gene frequency, and color indicates the average probability regulatory strength). (I) Top three genes (or TFs) ranked by “Var-score” for each cell type, along with their associated regulatory relationships, with TF genes highlighted in red in G and H.


