
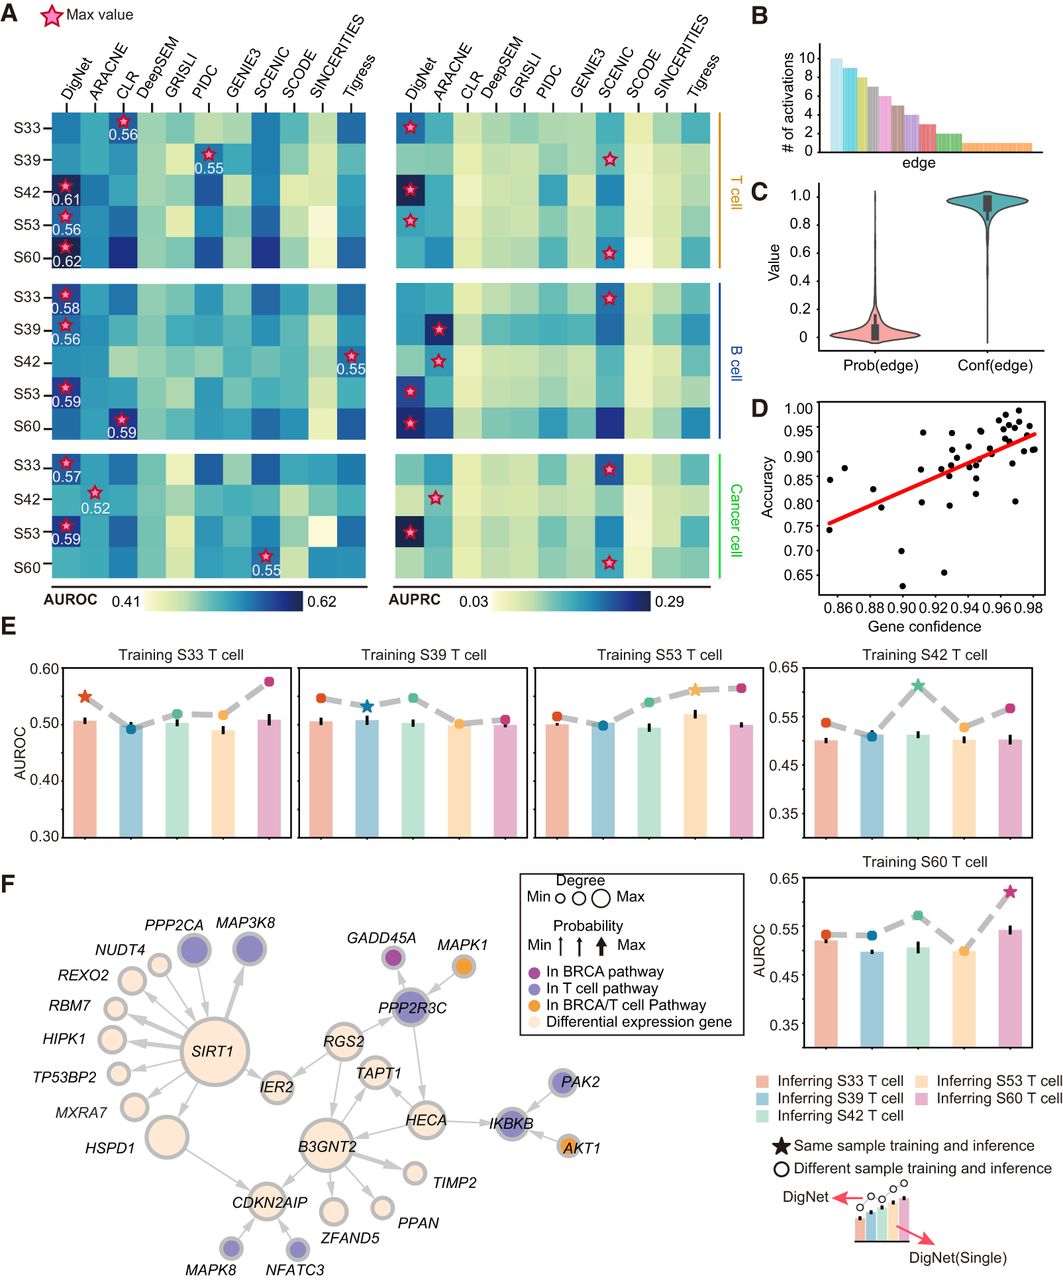
Performance evaluation and network analysis of DigNet in breast cancer case study. (A) AUROC and AUPRC results for DigNet applied to breast cancer single-cell data. The horizontal axis denotes individual cell types, and the vertical axis compares DigNet with 10 other alternative algorithms. (B) DigNet generates specific GRNs for T cells of patient S42 10 times. We have conducted a statistical summary of all the activated regulatory links, for which the horizontal axis represents the existing regulatory relationships, and the vertical axis indicates their frequency occurrence. (C) Prob and Conf represent the probability and confidence scores of all regulatory relationships across the 10-time generated networks, respectively. (D) Visualization of the relationship between accuracy and gene confidence, in which gene confidence is the aggregated confidences of generation edges associated with each gene. (E) Benchmark testing of DigNet across diverse individual cell environments. The dotted line shows the AUROC evaluation results for DigNet on different individual cells after a single training session, and the bar graph shows results from a single run of DigNet (excluding the ensemble network aggregation module). (F) Specific GRN generated for T cells of patients S33–S60, showcasing only subnetworks with relatively high node degrees for clarity.


