
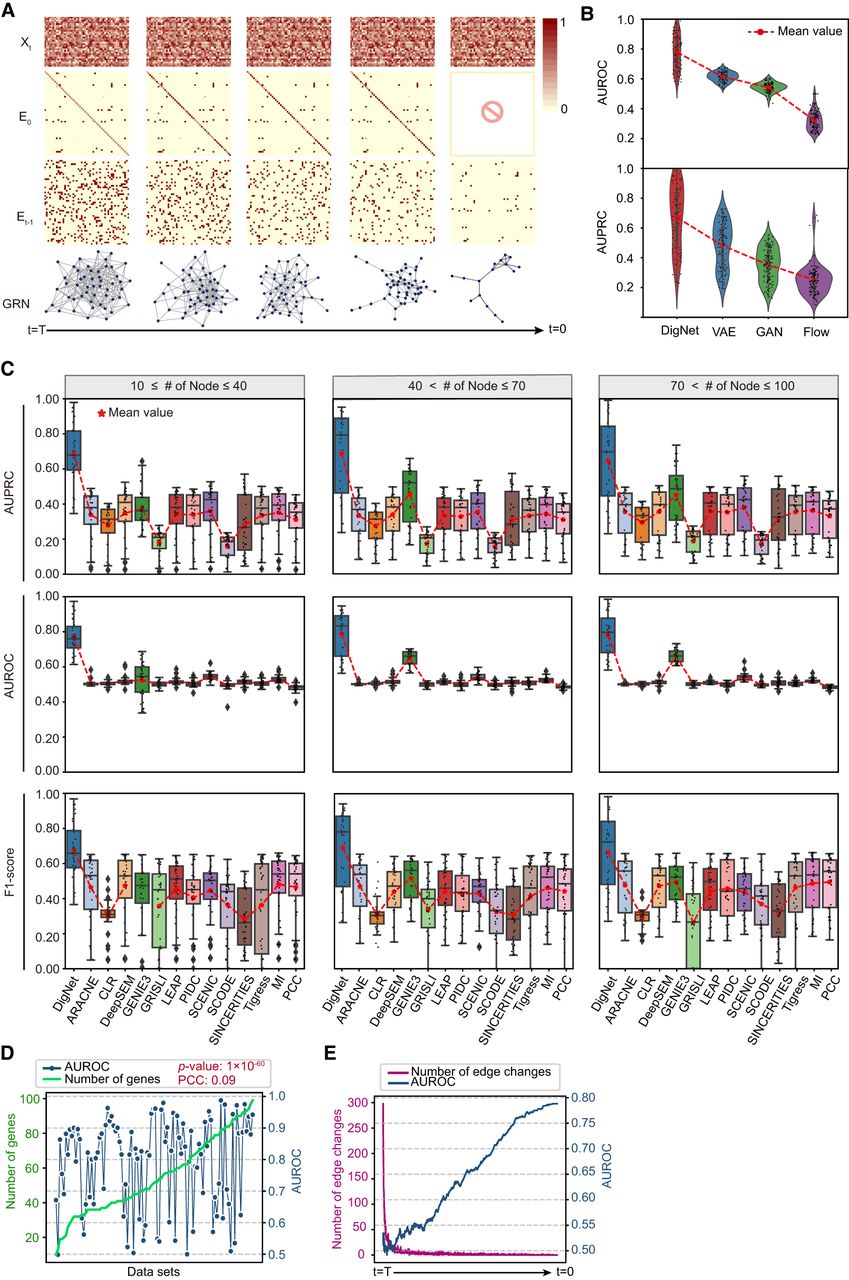
Benchmark evaluations of DigNet on simulation data sets. (A) The intermediate network illustration in progressively generating a clean network from a random network, where each column represents a snapshot in time, including the input data Xt, the predicted clean adjacency matrix E0, and the inferred output for the subsequent time-step Et−1. (B) Performance evaluation of DigNet compared with alternative generative models (diffusion vs. VAE, GAN, and Flow) in terms of AUROC and AUPRC. (C) Performance evaluation of DigNet and 13 other GRN inference algorithms using 100 synthetic data sets. The red line denotes the mean values of these comparison methods. (D) The evaluation for DigNet network generation capability on the size impact of the number of genes, using AUROC value with the calculation of t-test P-values and PCCs between them. (E) During the network generation, the comparison of the number of edges corrected by DigNet at different time points during network generation and its subsequent effect on the overall AUROC value.


