
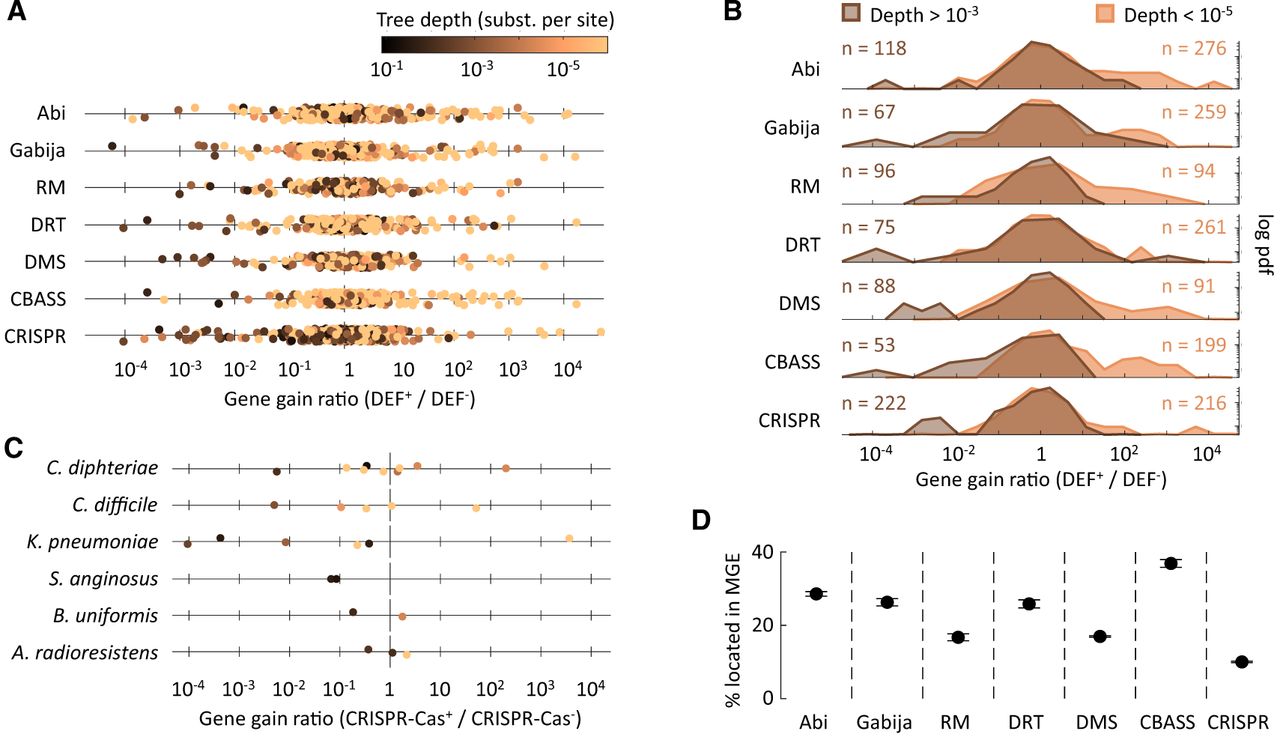
Association between defense systems and gene-gain rates depends on the timescale. (A) Ratio of overall gene-gain rates between sister clades that do and do not harbor defense systems (DEF+ and DEF−, respectively). Values greater (or smaller) than one indicate increased (or reduced) gene flux in lineages that contain the defense system. (B) Density distribution of the DEF+/DEF− gain ratios, comparing clades that represent recent acquisitions of the defense system (depth < 10−5 substitutions per site in core genes) and clades that have retained the defense system for longer times (depth > 10−3 substitutions per site). The probability density function (y-axis) is represented in logarithmic scale to facilitate the visualization of the tails. The skewness of all distributions is statistically significant (Supplemental Table S7), with positive values for recent clades and negative values for deeper clades. (C) Representative examples of gene-gain ratios in shallow and deeper sister groups from the same species. (D) Percentage of genes from different defense systems located within known MGEs. Whiskers represent 95% confidence intervals based on the binomial distribution.


