
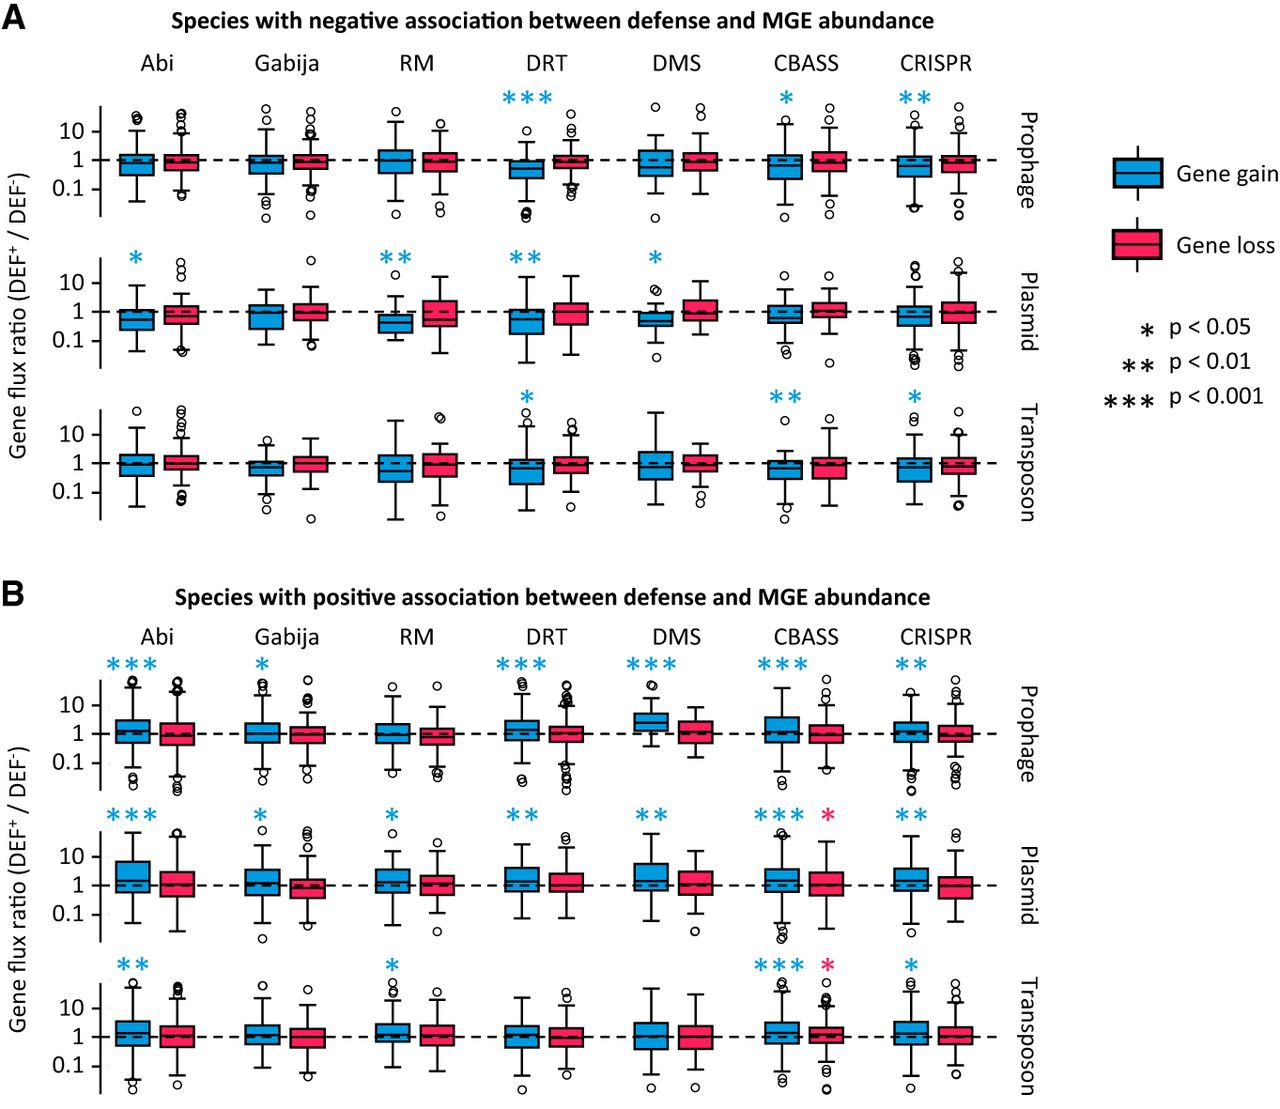
Relative differences in the rates of gene gain and loss between sister clades that do and do not harbor defense systems (DEF+ and DEF−, respectively). The boxplots represent the distribution of the DEF+/DEF− ratio of gene-gain (or -loss) rates for each class of MGEs, calculated for every pair of sister clades. Values greater (or smaller) than one indicate increased (or reduced) gene flux in lineages that contain the defense system. (A) Species that show a negative association between the defense system and the number of marker genes for each class of MGEs (PGLMM with smallest significant effect size criterion). (B) Species that show a positive association between the defense system and the number of marker genes for each class of MGEs. In the boxplots, the central line indicates the median, the box limits correspond to the 25 and 75 percentiles, and the whiskers extend to the largest and smallest values not classified as outliers. P-values are based on a Wilcoxon test with log-ratio = 0 as null hypothesis.


