
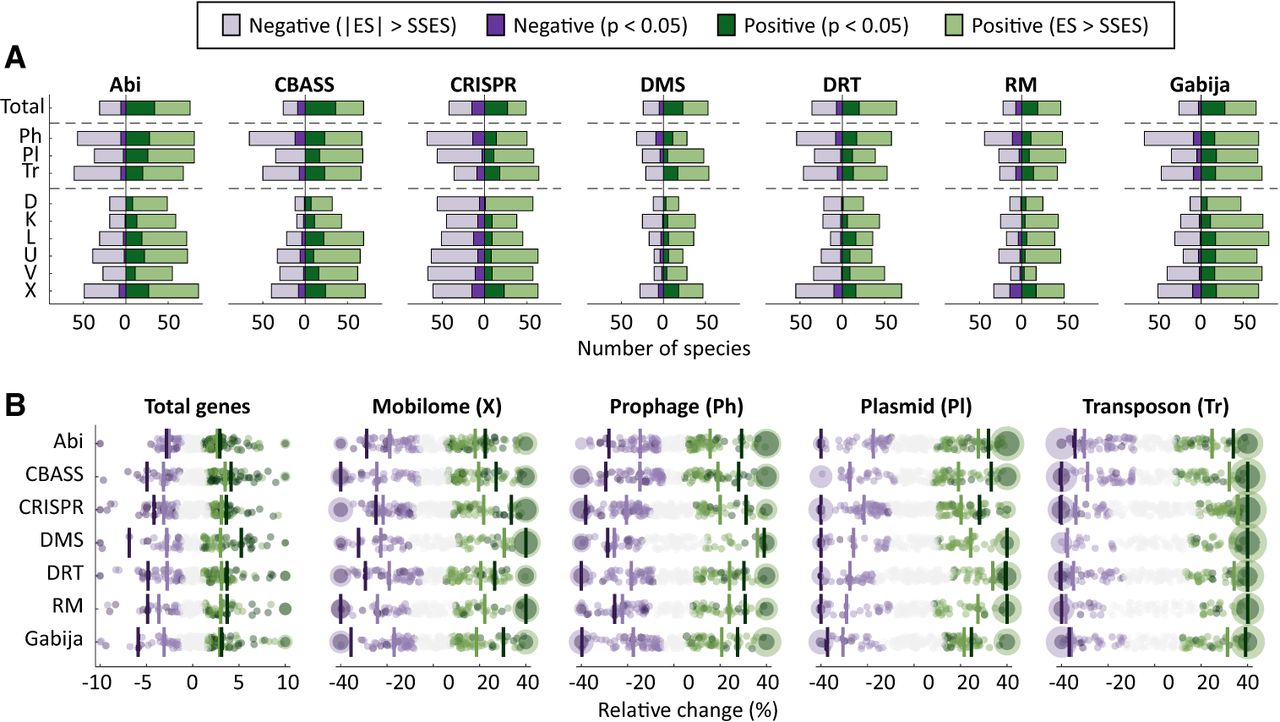
Association between seven widespread defense systems, total number of genes, and MGE abundance. (A) Number of species displaying positive or negative associations in a phylogenetic generalized linear mixed effect model (see Methods) according to two different criteria: statistical significance (P < 0.05) and absolute effect size greater than the smallest significant effect size (|ES| > SSES), separately computed for each response variable and defense system. (Note that because of cross-species differences in statistical power, the second criterion does not necessarily imply statistical significance.) The top row (total) indicates the association with the total number of genes. The association with MGEs was calculated based on marker genes for prophages (Ph), plasmids (Pl), and transposons (Tr). Abbreviations of functional categories: (X) mobilome; (L) replication, recombination, and repair; (U) intracellular trafficking and secretion; (K) transcription; (D) cell cycle control, cell division, and chromosome partitioning; and (V) defense. (B) Effect sizes, measured as relative differences in gene and MGE abundances. Each point corresponds to one species. Species with values beyond the axis limits are collapsed in a single point with size proportional to the number of species. Vertical lines indicate the median over all the species that show a positive or negative association according to the P-value and SSES criteria.


