
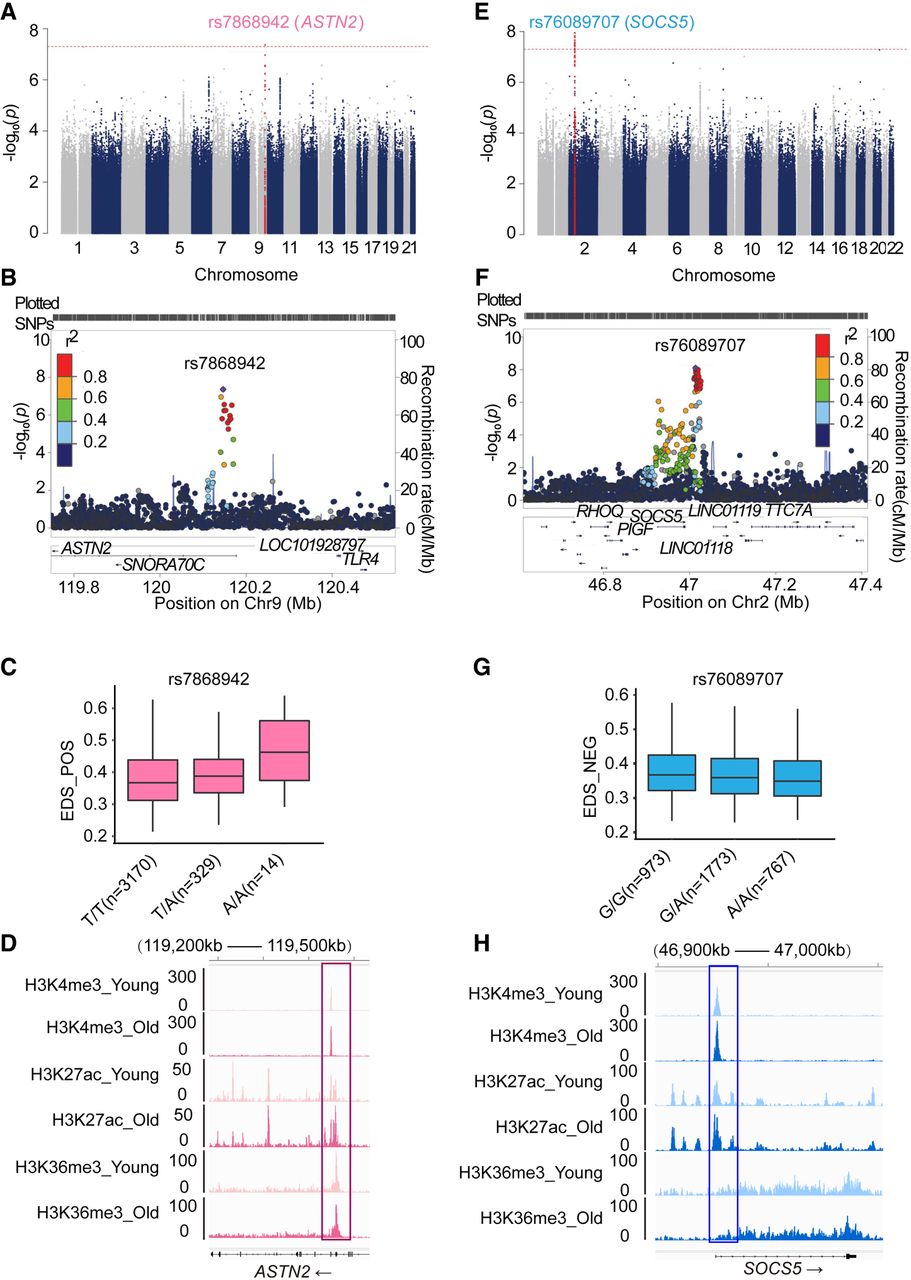
Figure 7.
GWAS results for epigenetic drift scores. (A) Manhattan plot showing SNP associations with EDS_POS. (B,C) Locus zoom plot (B) and genotype-specific differences (C) for lead SNP rs7868942 near ASTN2. (D) Aging is associated with a more active chromatin state at ASTN2 (loss of H3K36me3; gain of H3K4me3, H3K27ac). (E) Manhattan plot showing SNP associations with EDS_NEG. (F,G) Locus zoom plot (F) and genotype-specific differences (G) for rs76089707 near SOCS5. (H) SOCS5 chromatin becomes more active with age in hMSCs, marked by increased H3K4me3 and H3K27ac enrichment (McCauley et al. 2021).


