
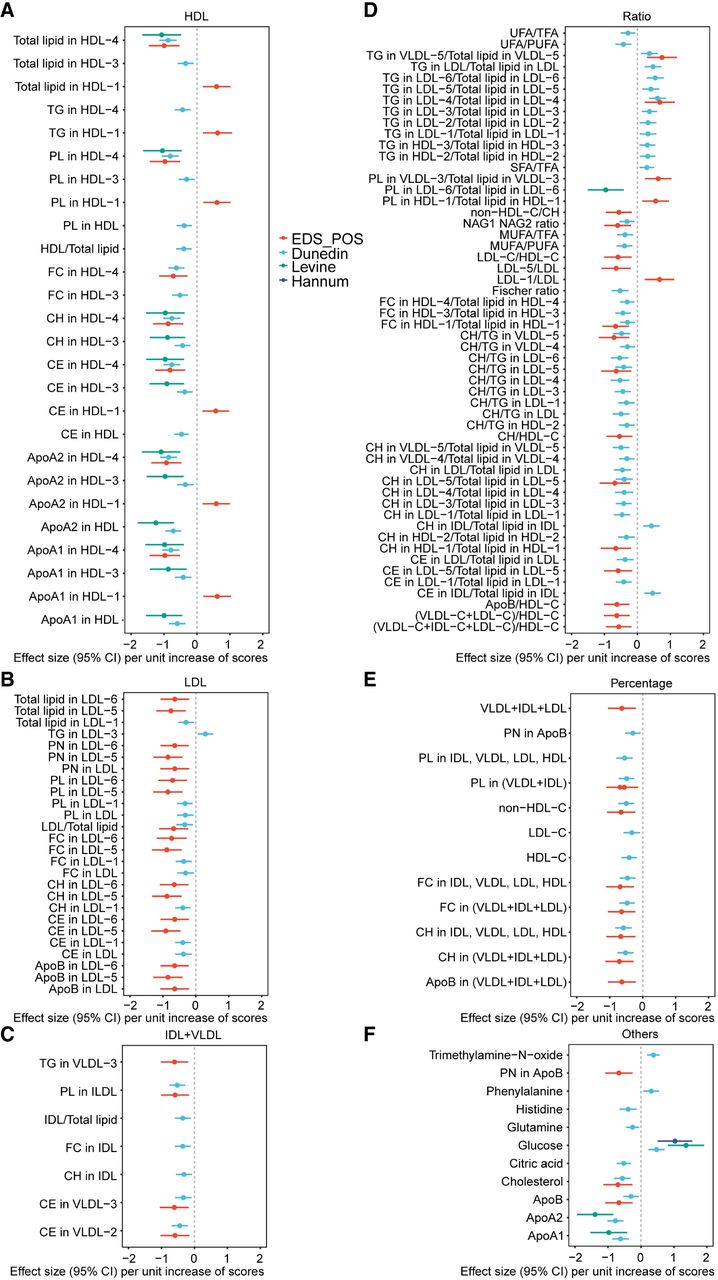
Associations of EDS_POS with serum lipid metabolic profiles. Forest plots display effect sizes (with 95% confidence intervals) per unit increase of relevant scores on various lipid metrics. The significance threshold for associations shown is set at FDR P < 0.05. Four epigenetic indicators are presented: EDS_POS (red), Dunedin (light blue), Levine (green), and Hannum (dark blue). (A) Associations with HDL-related traits. (B) Associations with LDL-related traits. (C) Associations with IDL- and VLDL-related traits. (D) Associations with lipid ratio metrics. (E) Associations with lipid percentage metrics. (F) Associations with other small metabolites and apolipoproteins. (ApoA1, ApoA2, ApoB) Apolipoprotein A1, Apolipoprotein A2, Apolipoprotein B, (CH) Cholesterol, (CE) Cholesteryl Esters, (FA) Fatty Acids, (FC) Free Cholesterol, (HDL) High-Density Lipoprotein, (IDL) Intermediate-Density Lipoprotein, (LDL) Low-Density Lipoprotein, (PL) Phospholipids, (PN) Particle Number, (TG) Triglycerides, (UFA/TFA) Unsaturated Fatty Acids/Total Fatty Acids ratio, (VLDL) Very Low-Density Lipoprotein. Subclass numbers indicate size-based lipoprotein subfractions. A complete list of all metabolite abbreviations and their full names is provided in Supplemental Table S6.


