
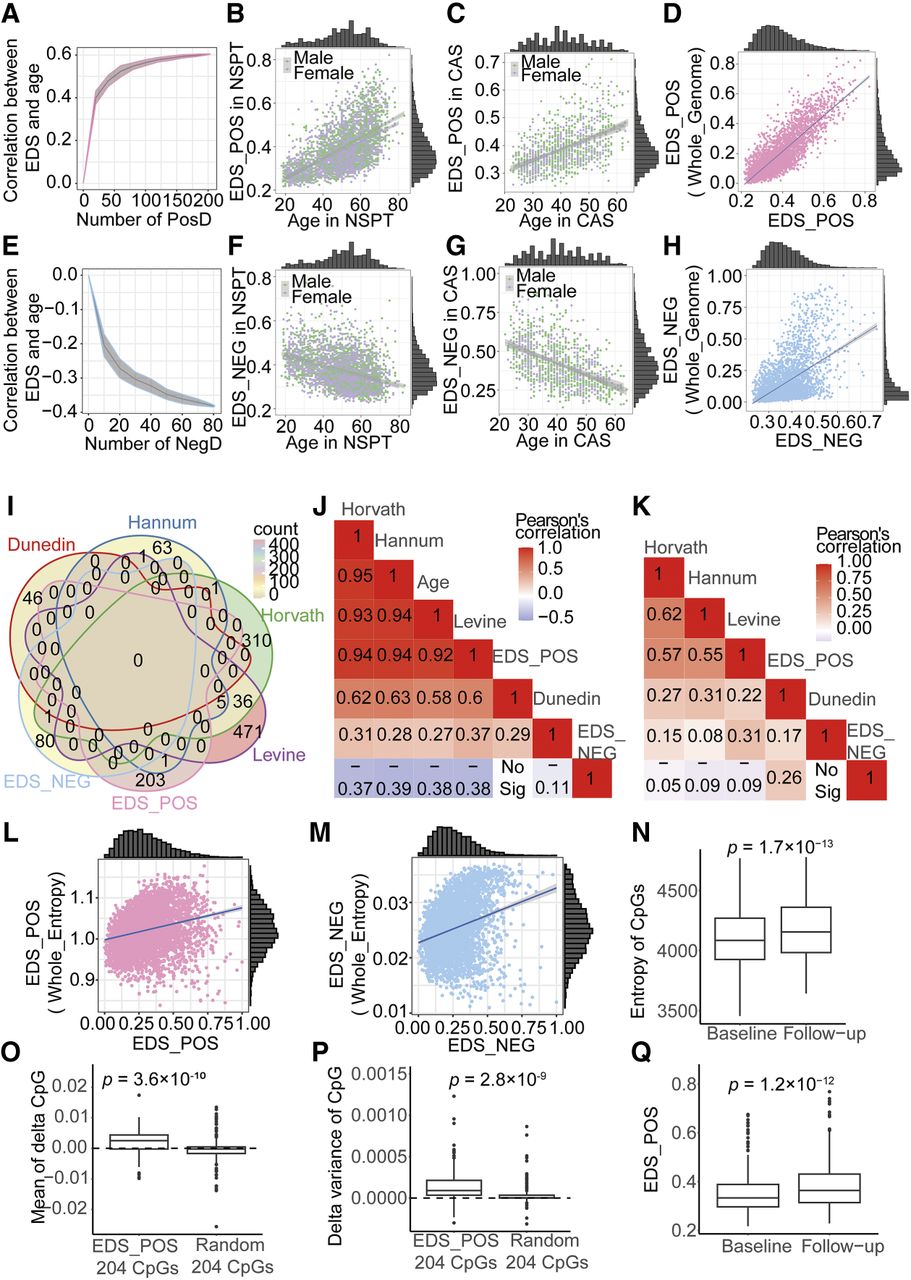
Validation and aging associations of the epigenetic drift score. (A) EDS_POS shows increasing correlation with age as more positive drift-CpGs are included. (B,C) Scatter plots of EDS_POS versus age in NSPT (B) and CAS (C), colored by gender. (D) EDS_POS significantly correlates with genome-wide positive EDS. (E–G) EDS_NEG similarly shows increasing age correlation (E) and gender-stratified associations in NSPT (F) and CAS (G). (H) EDS_NEG correlates with genome-wide negative EDS. (I) Venn diagram showing CpG overlap between EDS and four aging clocks. (J,K) Heat maps of correlations among EDS, aging clocks, and age, before (J) and after (K) age adjustment. (L,M) EDS_POS (L) and EDS_NEG (M) correlate with genome-wide methylation entropy. (N) Methylation entropy increases longitudinally over 4 years. (O–Q) EDS_POS CpGs show greater increases in methylation mean (O), variance (P), and EDS score (Q) over time compared to random CpGs.


