
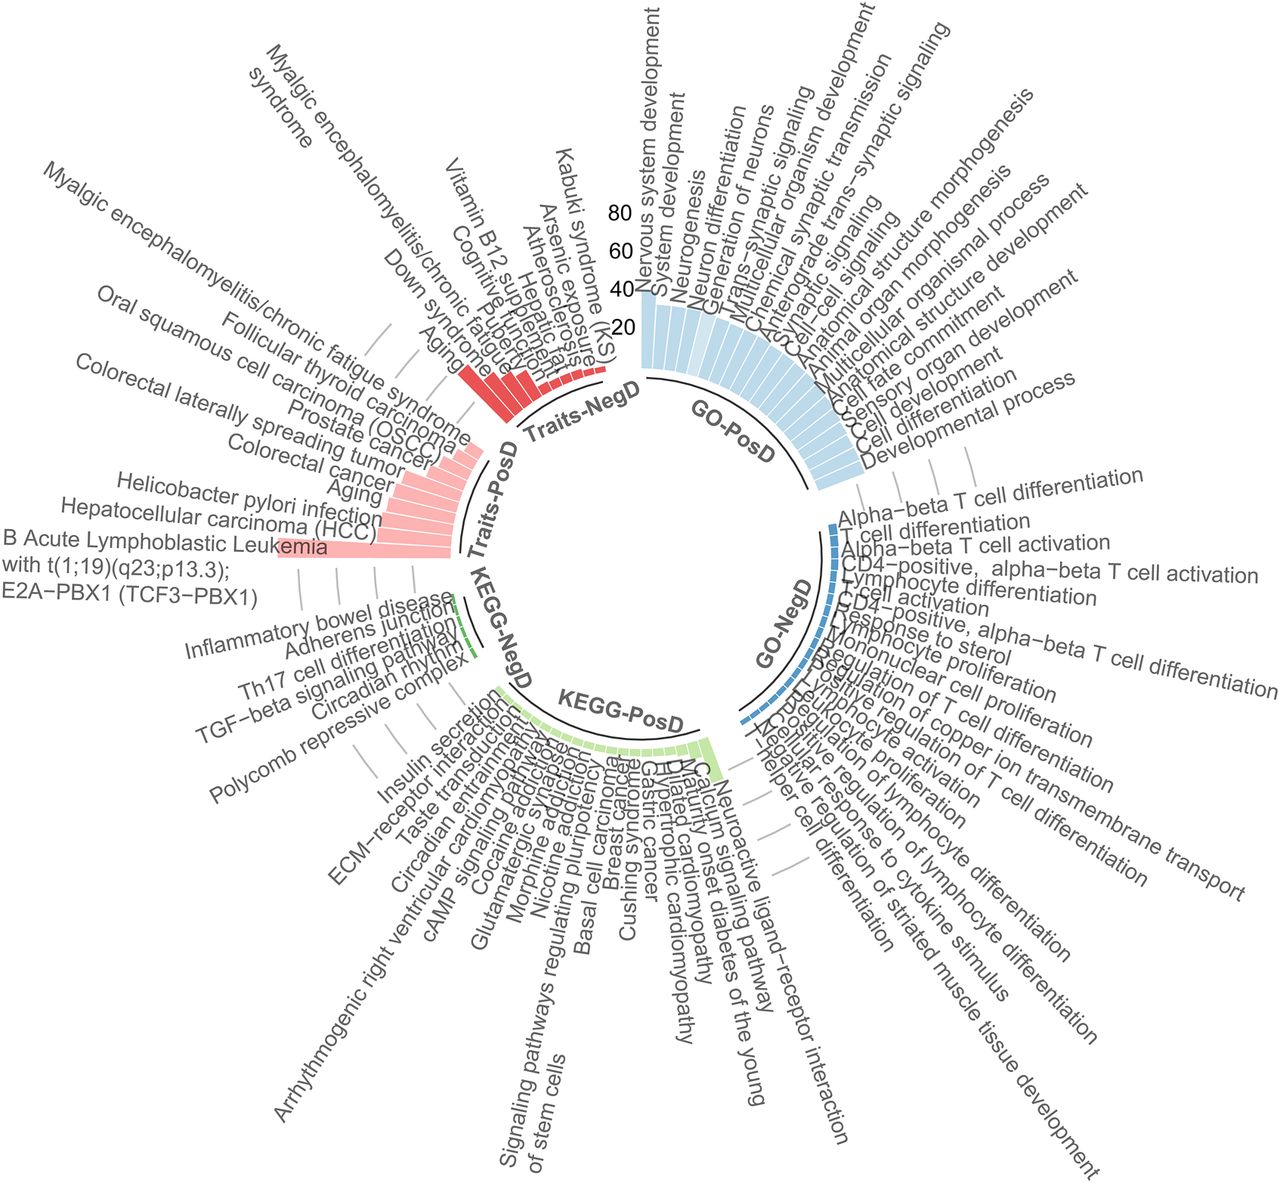
Figure 4.
Biological and trait enrichments of directional epigenetic drift. This circular plot visualizes Gene Ontology (GO) terms, KEGG pathways, and traits enriched for positive (PosD) and negative (NegD) drift-CpGs. Enrichment score, calculated as −log10(FDR P), increases with distance from center.


