
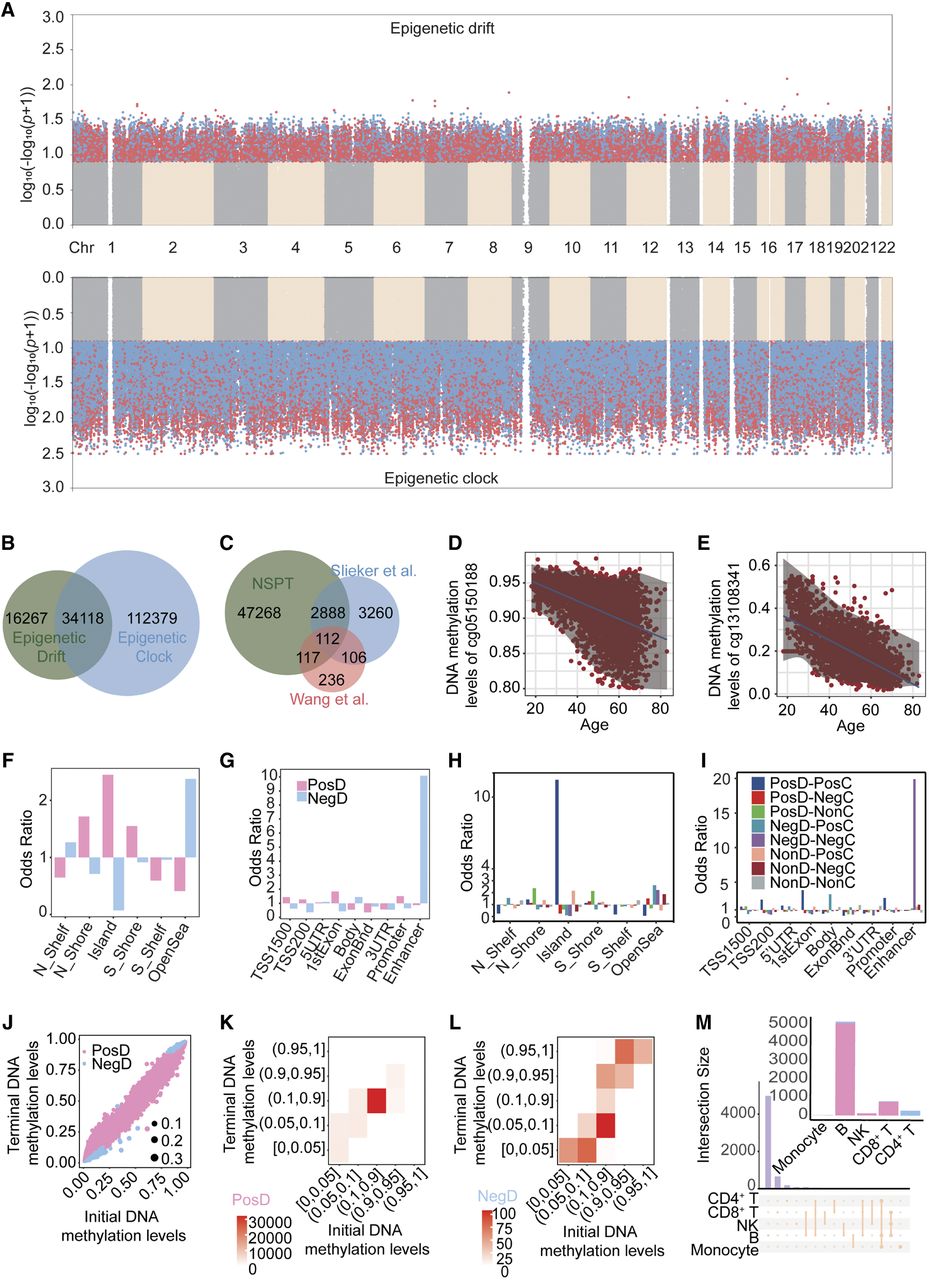
Epigenome-wide identification and annotation of drift- and clock-CpGs. (A) Manhattan plot of significant CpGs (P < 1 × 10⁻⁷), colored by drift (blue), clock (blue), or both (red) effects. (B) Venn diagram showing overlap between drift- and clock-CpGs. (C) Overlap of NSPT drift-CpGs with those from Slieker et al. (2016) and Wang et al. (2018). (D,E) Representative CpGs with age-related increase (D) or decrease (E) in methylation variance. (F,G) Genomic enrichment of positive and negative drift-CpGs (F: CpG island-related; G: gene-related features). (H,I) Genomic enrichment of drift- and clock-CpGs (H: CpG island-related; I: gene-related features). (J) Scatter plot of initial (young) versus terminal (old) methylation levels at drift-CpGs. (K,L) Heat maps of positive (K) and negative (L) drift-CpG distribution by methylation levels. (M) Upset plot showing cell type specificity of drift-CpGs across immune lineages. (PosD) positive drift-CpGs, (NegD) negative drift-CpGs, (PosC) positive clock-CpGs, (NegC) negative clock-CpGs, (NonD) nondrift CpGs, (NonC) nonclock CpGs.


