
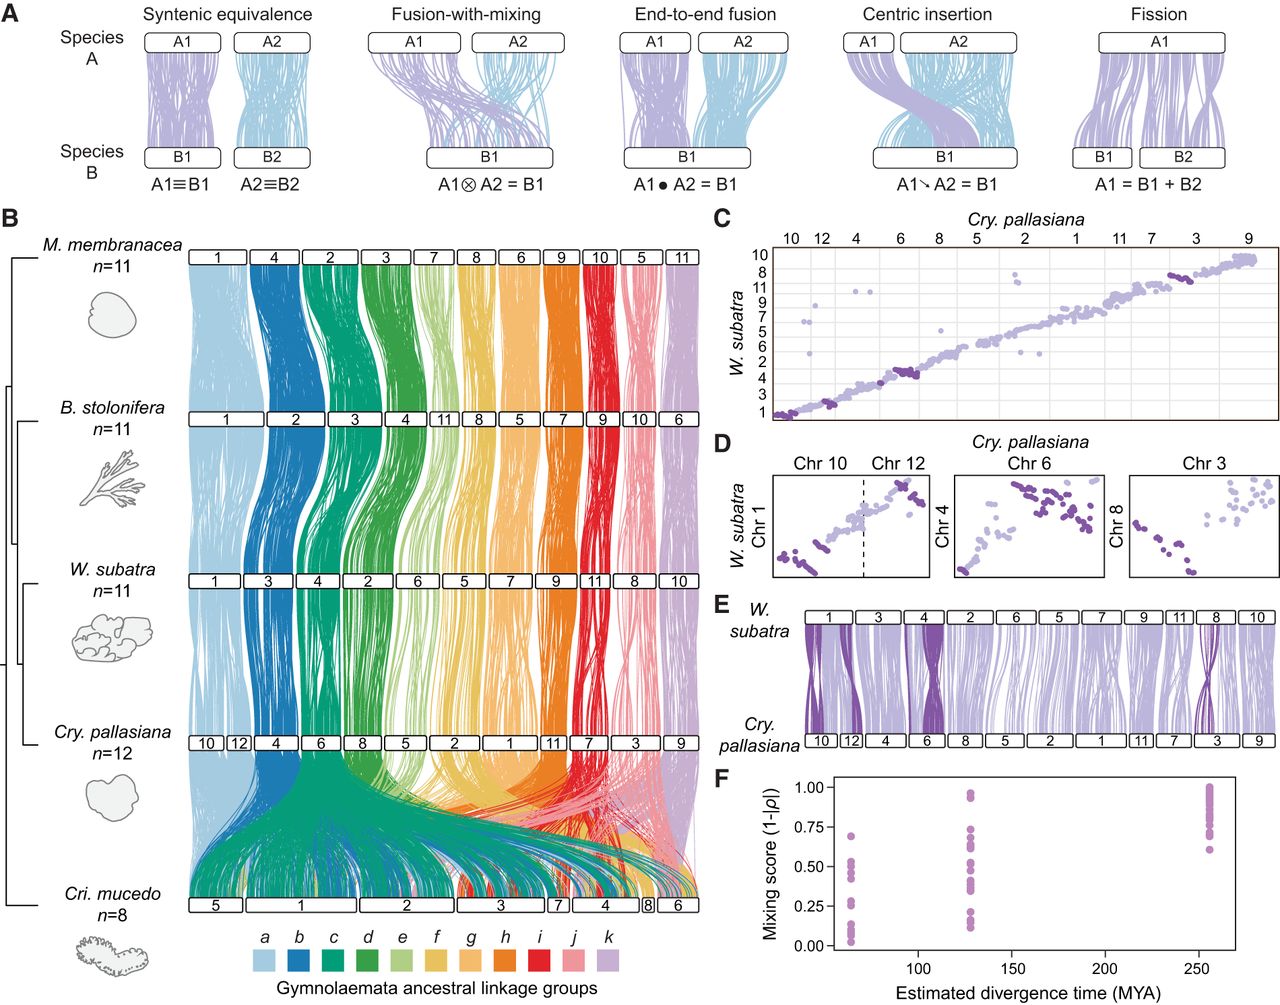
Chromosome rearrangement in gymnolaemate and phylactolaemate bryozoans. (A) Schematic representations of types of inter-chromosomal rearrangement events. White bars represent chromosomes, and colored lines connect orthologous genes; the same color line represents genes in the same ancestral linkage group (ALG). (B) Chromosome-scale gene linkage between five bryozoan species revealed by ribbon plots. Horizontal bars represent chromosomes, and vertical lines connect the genomic position of orthologous genes in each genome. Plot shows 4242 single-copy orthologous genes (average, 386 genes per linkage group). Chromosomes connected by many orthologs are inferred to be homologous (i.e., orthologous chromosomes). In gymnolaemate species, 11 ALGs a to k are highly conserved, although the chromosome containing ALG a underwent a fission event to form Chr 10 and Chr 12 in C. pallasiana. These ALGs are not conserved in the phylactolaemate species C. mucedo. Links between chromosomes sharing five or fewer genes between chromosomes are removed for clarity but can be seen in the Oxford dot plots. (C) Oxford dot plot revealing chromosome-scale gene linkage between the two most closely related species in our data set, C. pallasiana and W. subatra. Each axis represents the entire length of the genome of one species. Gray lines separate chromosomes. Each point represents a pair of orthologs placed by their ordinal position in each genome. Strings of orthologs perpendicular to the main diagonal axis reveal clear intra-chromosomal inversions (dark purple). (D) Single-chromosome Oxford dot plots for C. pallasiana and W. subatra chromosomes with clear intra-chromosomal inversions (dark purple). (E) Ribbon plot for C. pallasiana and W. subatra highlighting intra-chromosomal inversions (dark purple). (F) Microsynteny mixing score versus divergence time for gymnolaemate bryozoan chromosomes across species. Comparisons are grouped by estimated divergence time: <100 million years ago (MYA), C. pallasiana versus W. subatra; 100–150 MYA, C. pallasiana and W. subatra versus B. stolonifera; >250 MYA, C. pallasiana, W. subatra, and B. stolonifera versus M. membranacea. Each point represents a chromosome. The microsynteny mixing score measures how genes are shuffled within a chromosome by intra-chromosomal inversions (see Methods): A higher score indicates more mixing. Mixing scores increase with phylogenetic distance.


