
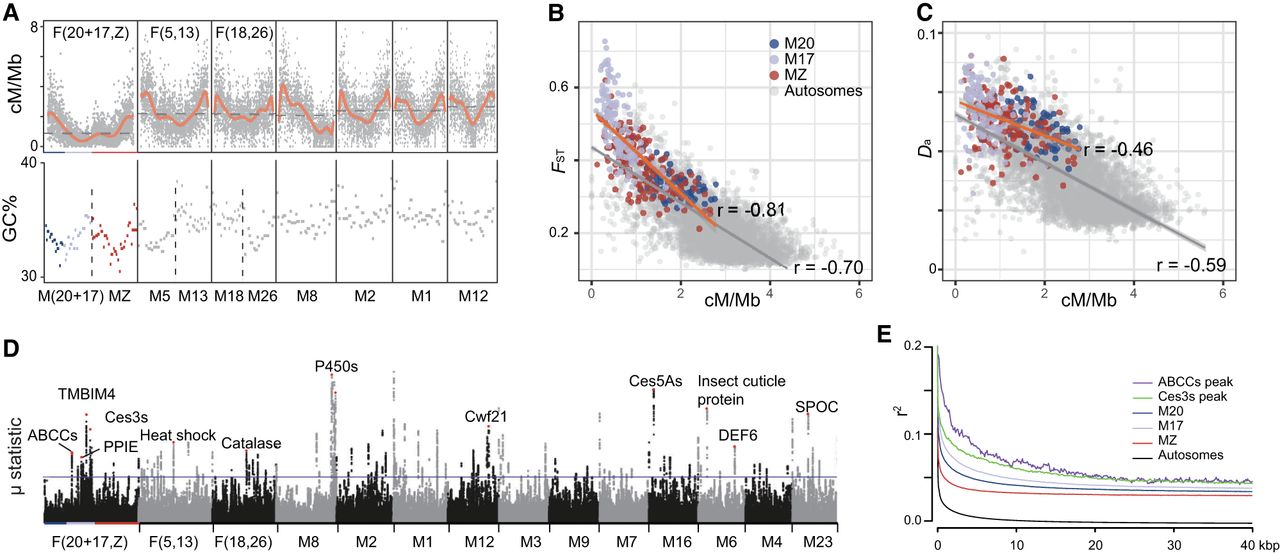
Landscapes of recombination and selection in G. molesta. (A, top) The recombination rate (in units of cM/Mb) of the seven longest chromosomes in G. molesta; (bottom) the intron GC content of the upper-corresponding chromosome elements in outgroup Sesia bembeciformis, reflecting the recombination landscape prior to the fusion. The orange lines indicate the 10th-degree polynomial regression curve. Horizontal dashed lines indicate the average recombination rate for each chromosome. The horizontal axis of GC content in S. bembeciformis was scaled to suit the chromosome length of G. molesta. (B,C) Correlations of the recombination rate with interspecific FST and Da in 100 kb sliding windows. (D) Signals of selective sweeps in G. molesta. The purple horizontal line shows the cutoff for 0.5‰ μ-statistics. (E) Distributions of linkage for different regions of chromosomal elements and the two gene clusters that are marked in red in D.


