
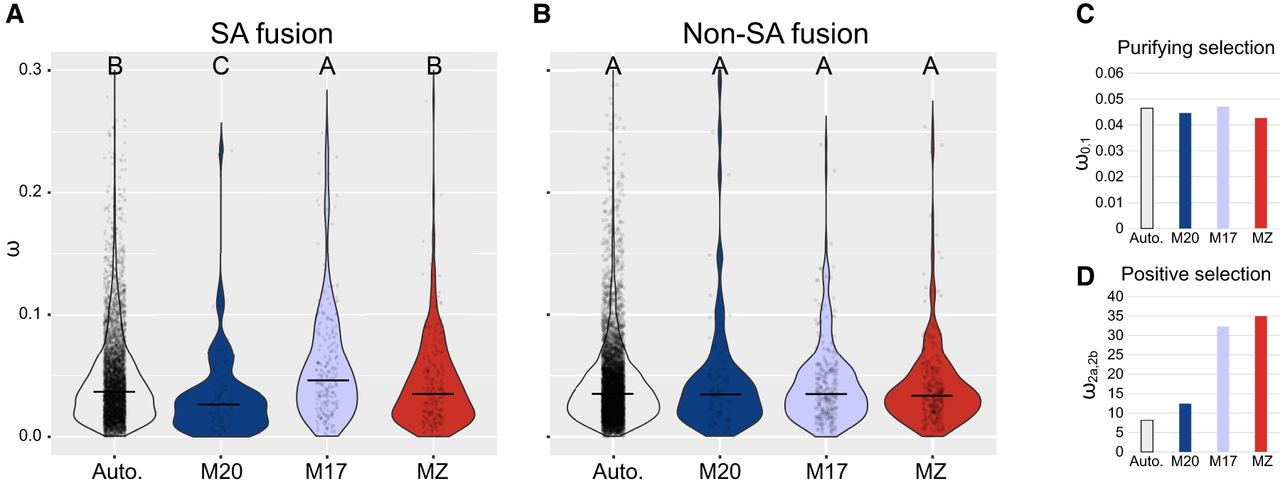
Figure 3.
Comparison of molecular evolution rates among chromosomal elements on neo-Z. (A,B) Violin plots of gene-wide ω on different chromosomal elements within the SA fusion (Tortricidae) and non-SA fusion (outgroups) clades. Significant differences from Mann–Whitney U tests (α = 0.01) are marked using uppercase letters. The horizontal lines show the medians. (C,D) Molecular evolution rate (ω) of different chromosomal elements. The term ω0,1, indicates sites under purifying selection (ω0) or neutral evolution (ω1) in both Tortricidae and the outgroups. The term ω2a,2b, indicates sites under purifying selection (ω2a) or neutral evolution (ω2b) in the outgroups but under positive selection in the Tortricidae.


