
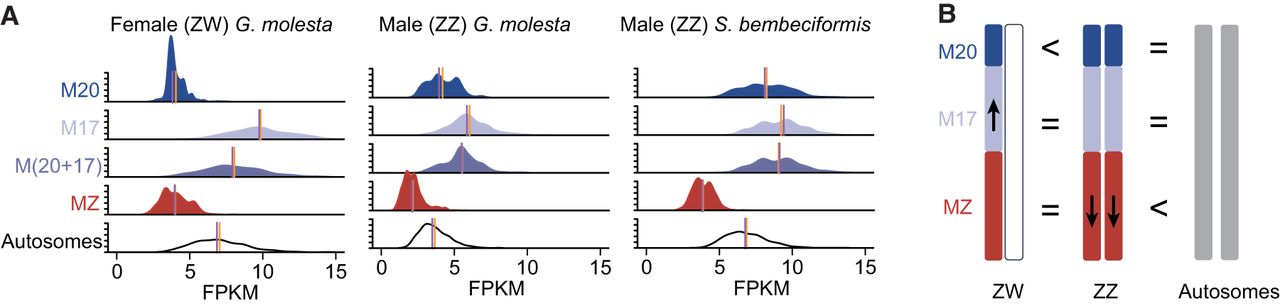
Figure 2.
Patterns of sex chromosome dosage compensation (SCDC) of neo-Z in G. molesta. (A) Comparisons of gene expression among chromosomal elements by bootstrapping of FPKM. The purple and yellow lines, respectively, indicate the median of raw FPKM and the average of resampled FPKM medians. The vertical axis shows the distribution density in the range from zero to 0.5. (B) A model of SCDC in the neo-Z Chromosome. The arrows indicate the up- or downregulation of expression in chromosomal elements.


