
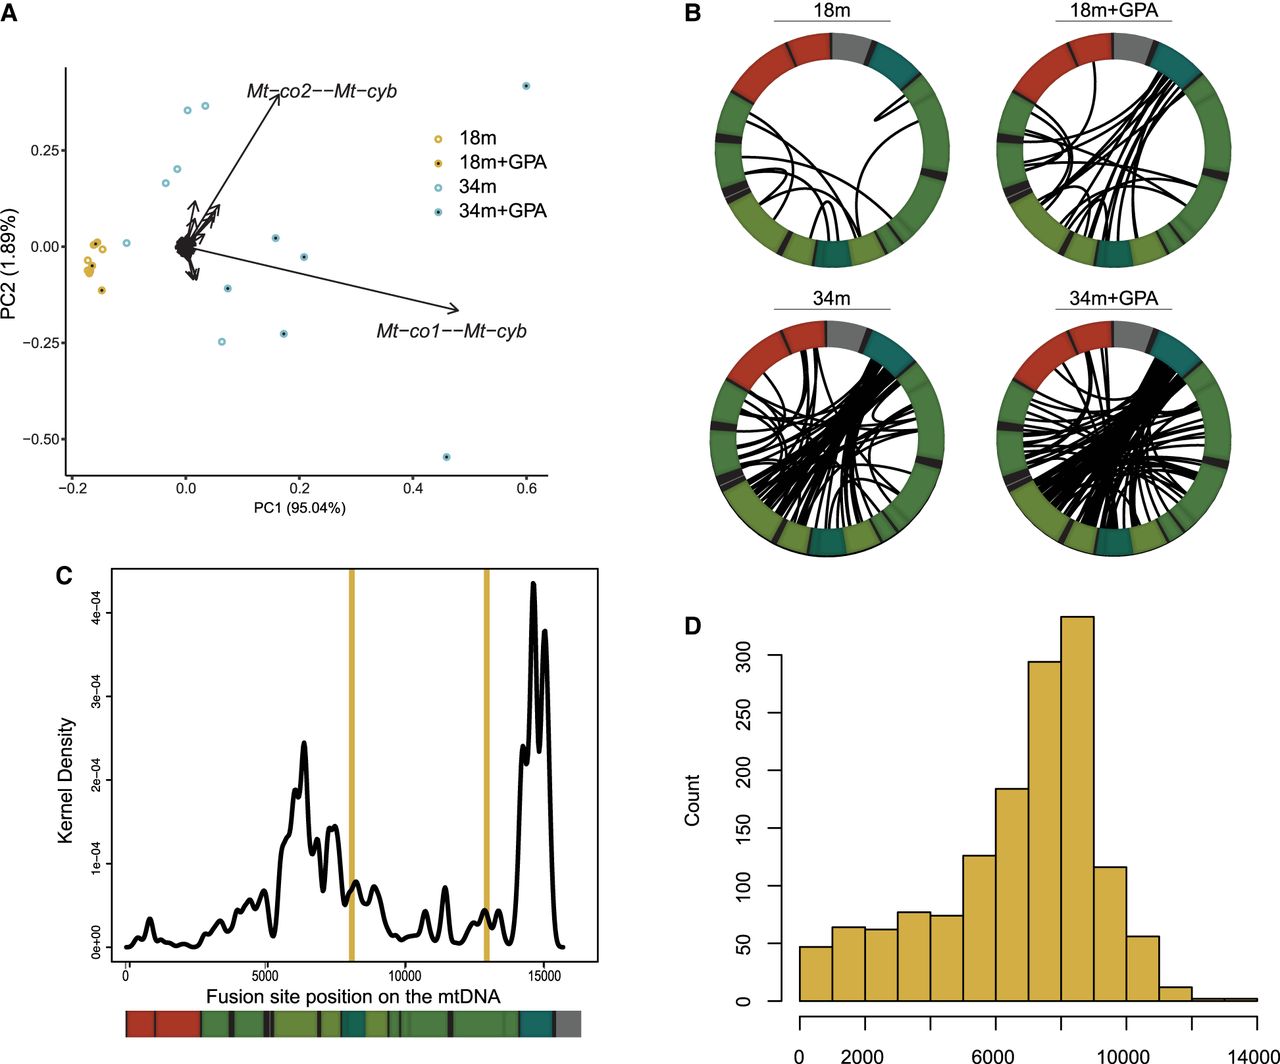
Figure 6.
Mapping of age- and drug-induced mtRNA fusion events in rats. (A) PCA plot of rat chimeric mtRNA data. (B) Distribution of chimeric mtRNA breakpoints for representative sample from each category mapped onto a diagram of the wild-type mitochondrial genome. (C) Location of chimeric ends across the rat mitochondrial genome. Vertical yellow bars denote the location of the longest direct repeats (16 bp) in the rat mtDNA reference genome (located at positions 8102 and 12,936). (D) Histogram of fusion event sizes for the chimeric mtRNAs.


