
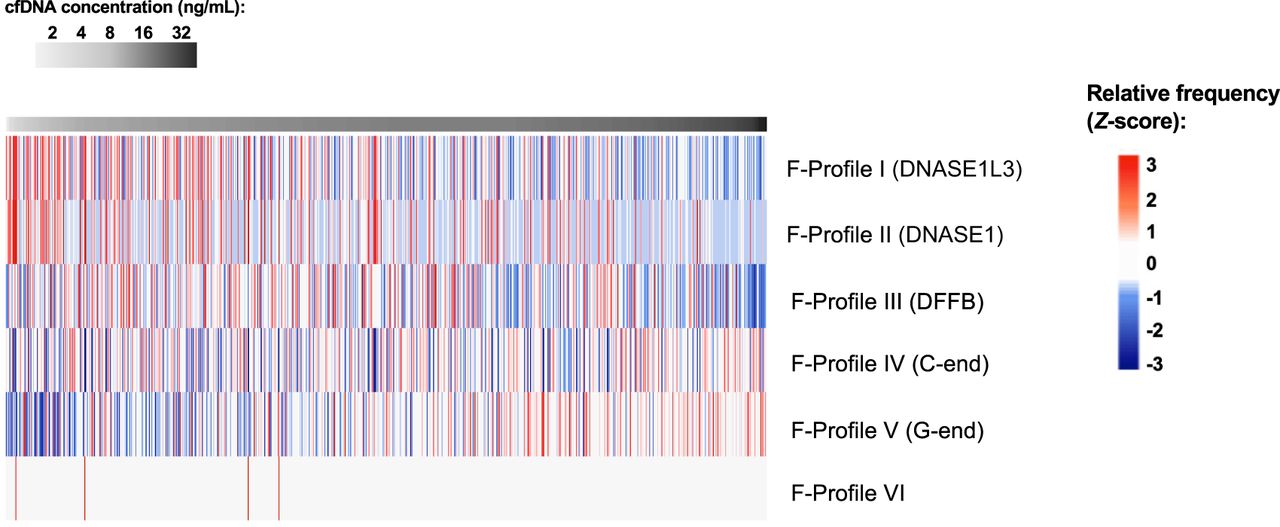
Figure 5.
Deconvolutional analysis of end motifs to deduce the contribution of the six “founder” end motif profiles (F-profile) of plasma DNA fragments within the 231–600 bp size range, among subjects of different cfDNA concentrations. Heatmap analysis was performed, with each row showing the contributions (expressed as z-scores) of each F-profile across subjects with different cfDNA concentrations.


