
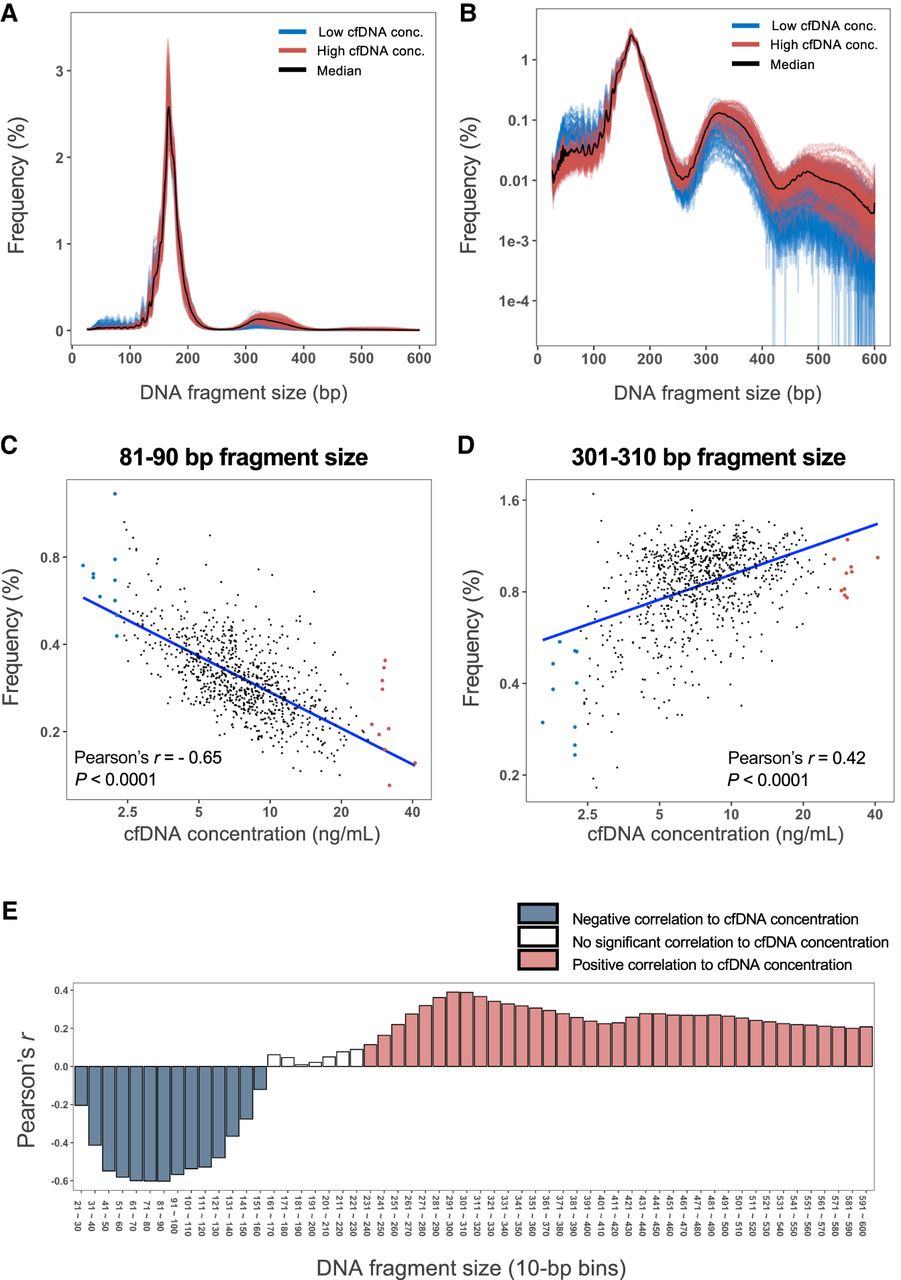
Figure 3.
Size profile of plasma DNA fragments in subjects of different cfDNA concentrations. The size profiles of the selected lowest and highest 10% of subjects, and the median distribution of the cohort, are shown in linear scale (A) and logarithmic scale (B). Correlation between the frequency of DNA fragments within each 10 bp window bin and cfDNA concentration was assessed for all subjects, for the 81–90 bp fragment size range (C), 301–310 bp fragment size range (D), and across all 10 bp bins from 20 to 600 bp (E). Blue and red labels indicate 10 bp bins with a statistically significant negative or positive correlation to cfDNA concentration, respectively.


