
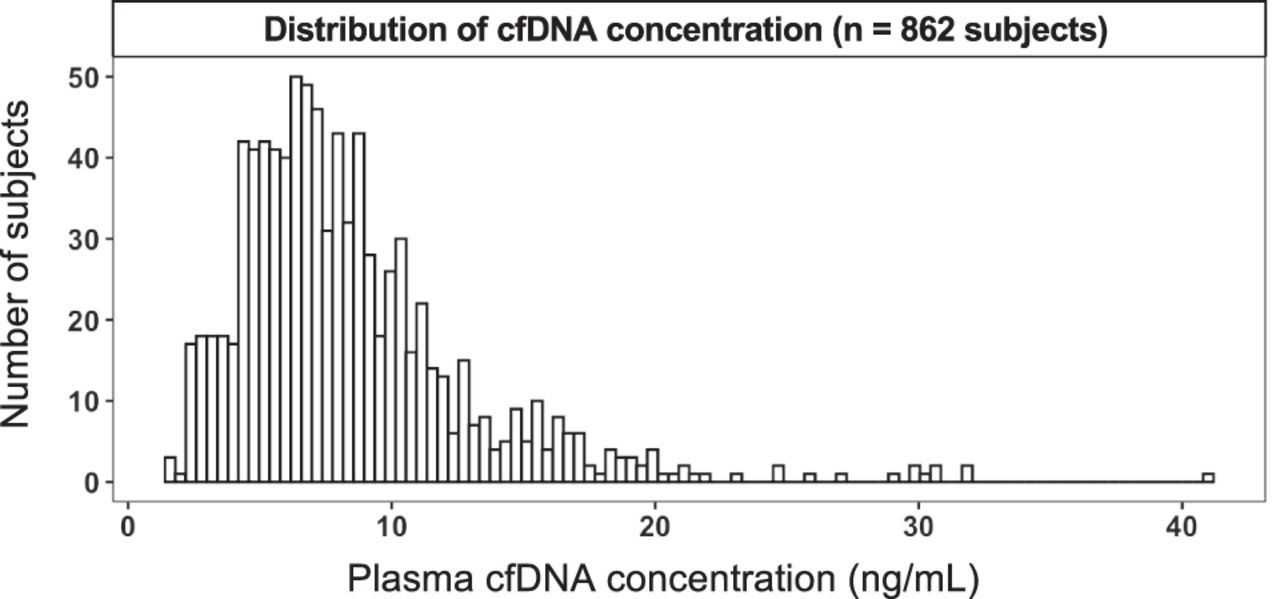
Figure 2.
Frequency distribution histogram plot showing the distribution of plasma cfDNA concentration from 862 individuals of the study cohort.
(Downloading may take up to 30 seconds. If the slide opens in your browser, select File -> Save As to save it.)
Click on image to view larger version.
Frequency distribution histogram plot showing the distribution of plasma cfDNA concentration from 862 individuals of the study cohort.
 CiteULike
 Delicious
 Digg
Digg Facebook
 Google+
 Reddit
 Twitter
