
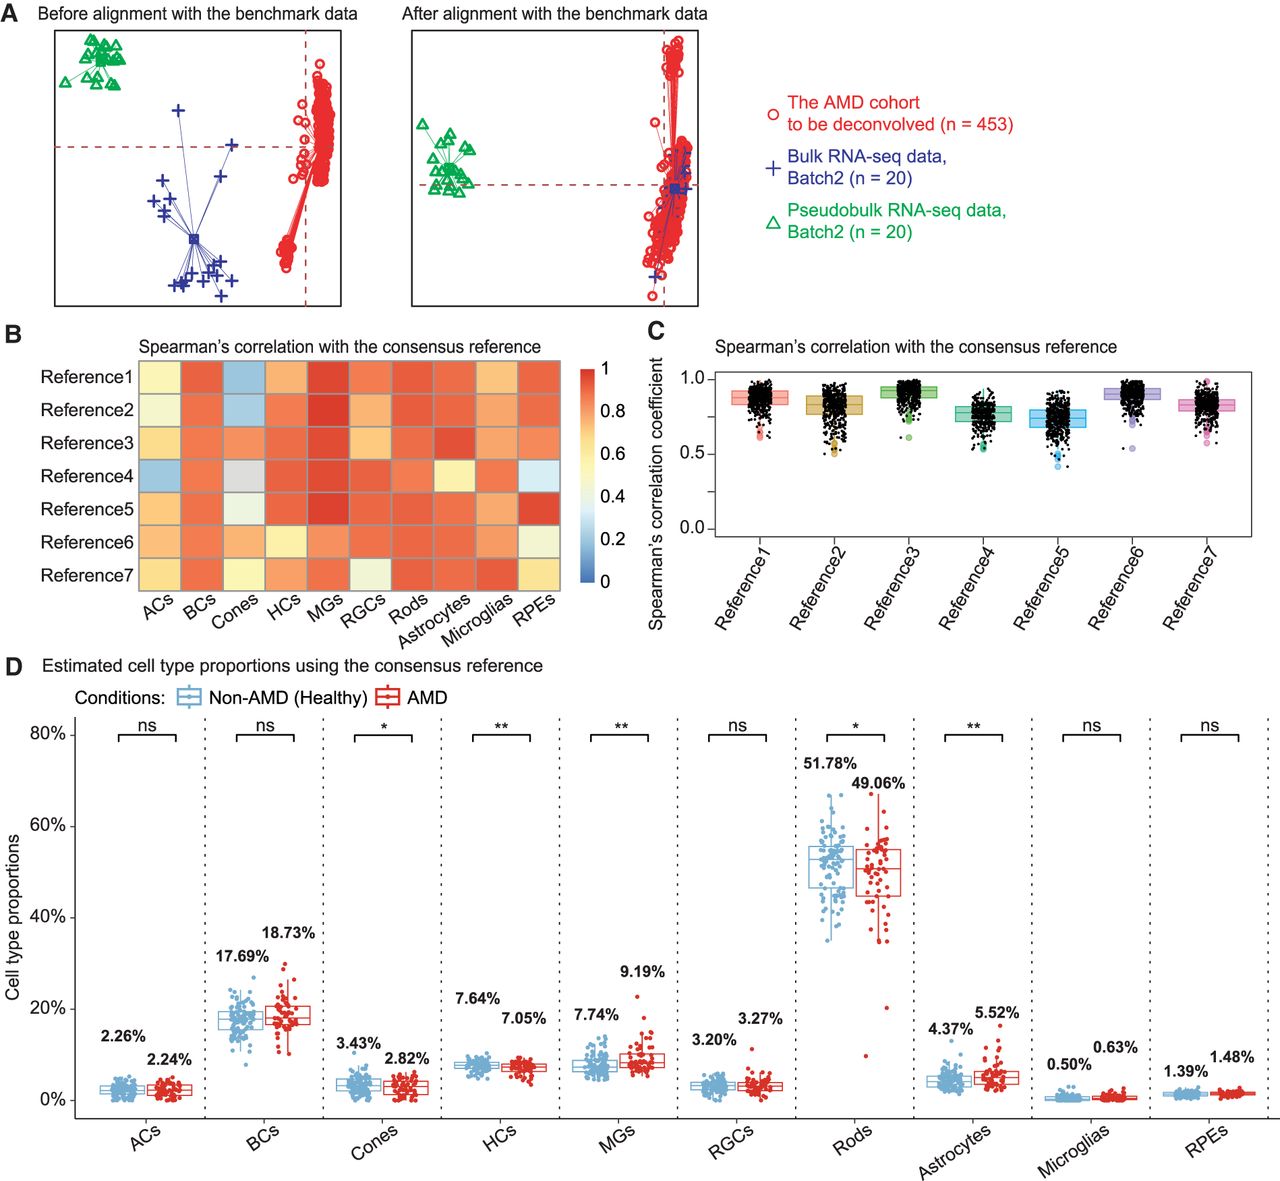
Using DeMixSC to deconvolve a large cohort of human peripheral retinal samples. (A) PCA plots of both the retina cohort data and the benchmark data. Red denotes the bulk data to be deconvolved; blue denotes the benchmark bulk data; and green denotes the benchmark pseudobulk data. (B,C) Panels demonstrating the robustness of DeMixSC to different reference matrices at both the cell type and sample levels. Higher correlation coefficients indicate better performance. (D) Distributions of DeMixSC estimated cell type proportions of Ratnapriya et al. (2019) data using consensus references. Each panel corresponds to a given cell type. The P-values for Student's t-tests comparing the estimated cell type proportions between non-AMD (healthy) and AMD groups are denoted as follows: (ns) not significant, P-value > 0.05; (*) P-value ≤ 0.05; (**) P-value ≤ 0.01; and (***) P-value ≤ 0.001.


