
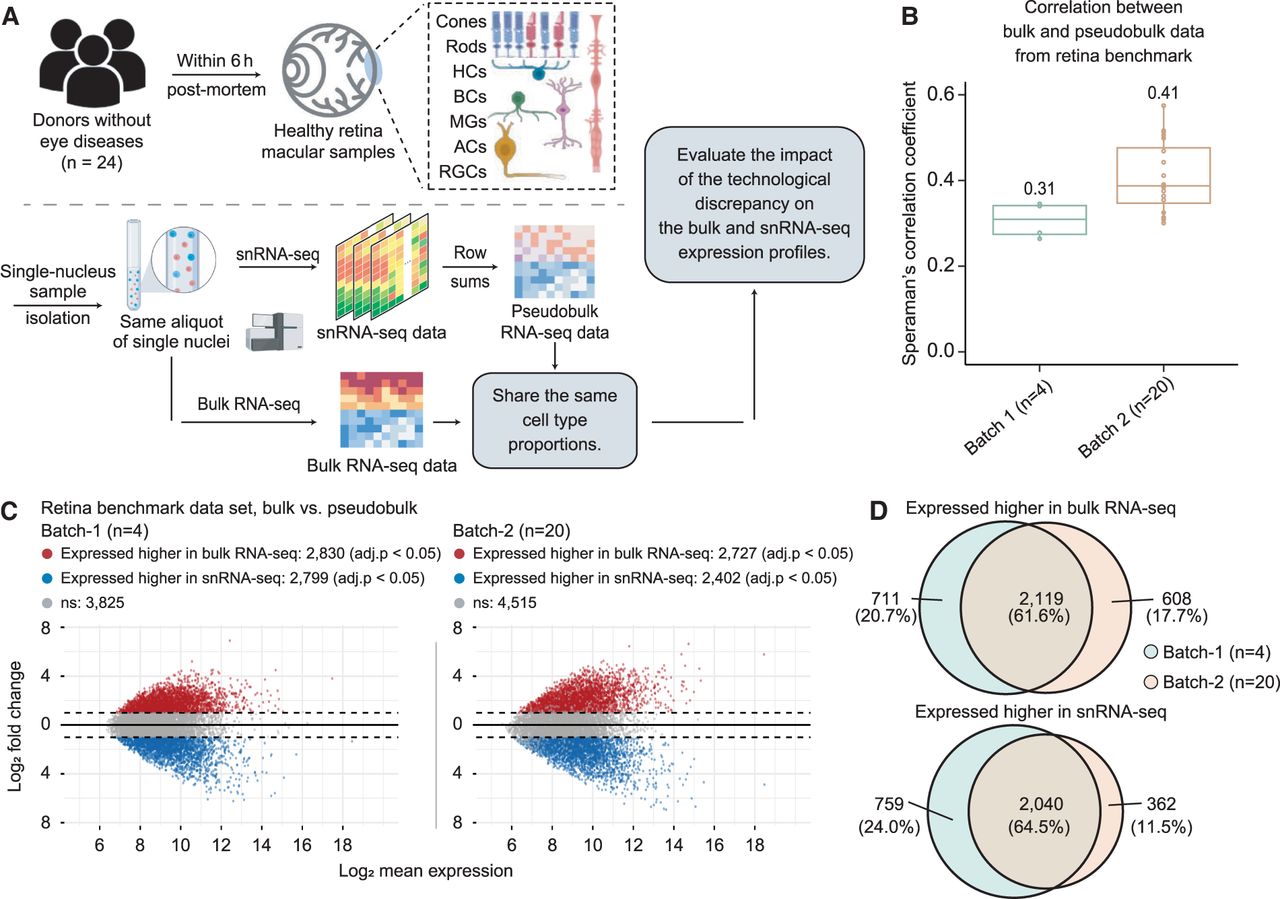
Assessing technological discrepancy between bulk and single-cell sequencing platforms using matched single-nucleus aliquots. (A) Workflow for generating a benchmark data set. We collect 24 healthy human retinal samples within 6 h postmortem. An illustration shows the layer and cell compositions of the human retina. Seven major cell types include photoreceptors (rod and cone cells), bipolar cells (BCs), retinal ganglion cells (RGCs), horizontal cells (HCs), amacrine cells (ACs), and Müller glia cells (MGs). Three minor cell types are not depicted in the illustration: astrocytes, microglia cells, and retinal pigment epithelial cells (RPEs). Samples are isolated into single-nucleus suspensions. The same aliquot of single nucleus is used for both bulk and snRNA-seq profiling. The matched pseudobulk mixtures are generated as conventionally done by summing UMI counts across cells from all cell types in each sample. This data generation pipeline guarantees the matched bulk and snRNA-seq data share the same cell type proportions, which enables us to evaluate the impact of technological discrepancy (i.e., the shot-gun sequencing procedure) on the bulk and snRNA-seq expression profiles. (B,C) The influence of technological discrepancy at the sample and gene level, respectively. (B) Spearman's correlation coefficient across genes between the matched real-bulk and pseudobulk RNA-seq data for one sample at a time for both batches. The correlations were calculated using quantile-normalized expression data (relative abundances). (C) MA-plots displaying the mean expression levels of all genes between matched real-bulk and pseudobulk data. Differentially expressed (DE) genes are identified using the paired t-test with Benjamini–Hochberg (BH) adjustment. Red represents genes expressed higher in the real bulk, and blue represents genes expressed higher in the pseudobulk. The horizontal dotted lines denote a twofold change between matched real-bulk and pseudobulk data. (adj.p) Adjusted P-values. (D) Venn diagrams showing genes consistently expressed higher in the bulk (top, overlap of red dots in panel C) or the snRNA-seq generated pseudobulk (bottom, overlap of blue dots in panel C) between the two batches, which were generated using different tissue samples and a different time.


