
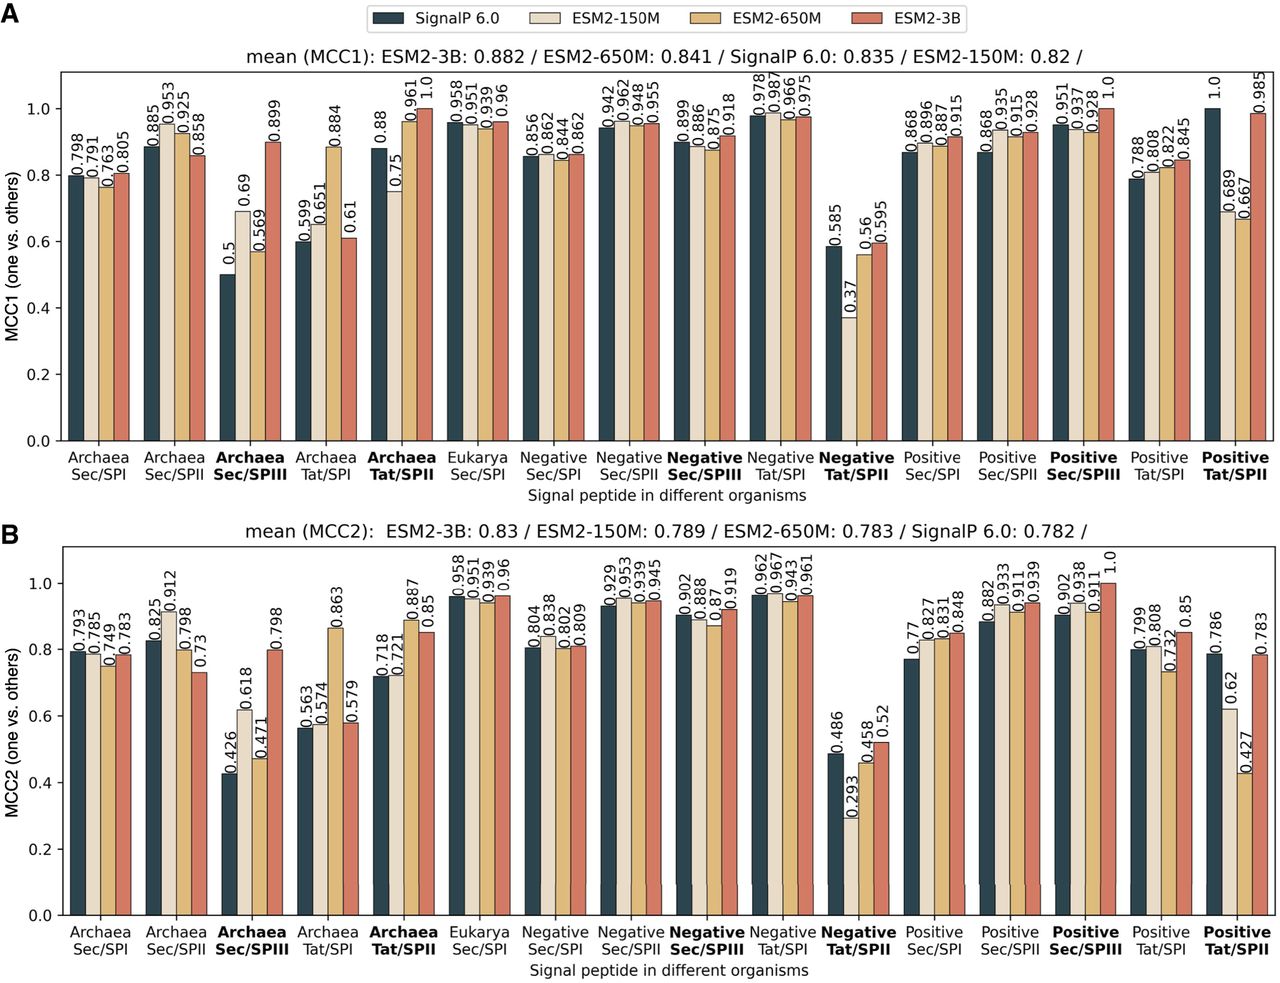
Figure 1.
PEFT-SP using LoRA and SignalP 6.0 performance in terms of MCC score for each SP type across different organisms. The bold text in the x-axis represents the SP type with small training samples. The MCC1 and MCC2 scores are shown above the bars. The sorted mean values for MCC1 and MCC2 are listed at the top. (A) MCC1 scores performance on a negative class composed of soluble and transmembrane proteins. (B) MCC2 scores performance on a negative class comprising soluble and transmembrane proteins and other SP types.


