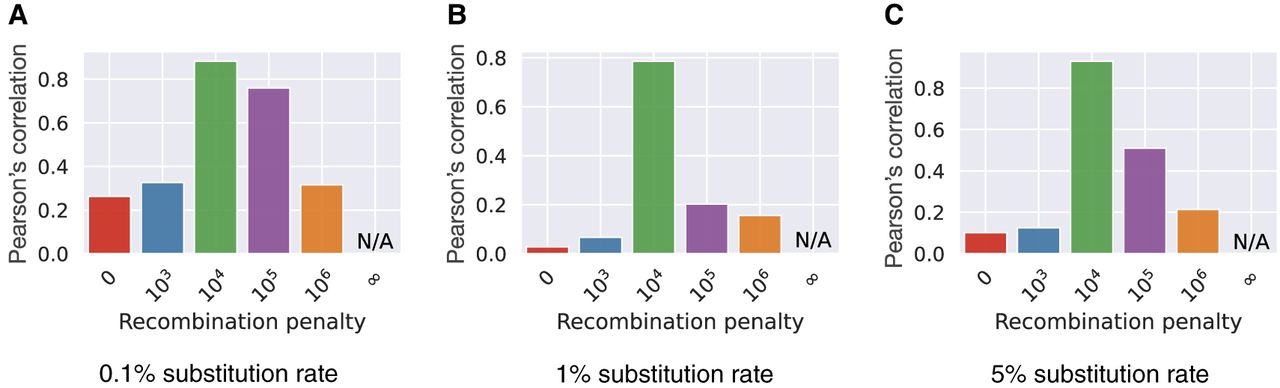
Haplotype-aware sequence alignment to pangenome graphs

(Downloading may take up to 30 seconds. If the slide opens in your browser, select File -> Save As to save it.)

Click on image to view larger version.

Figure 6.
Figure 6.

Pearson's correlation between the number of recombinations in Minichain's output chain and the true count. We evaluated the performance with substitution rates 0.1% (A), 1% (B), and 5% (C) and different recombination penalties.

This Article

  1. Genome Res. 34: 1265-1275

Preprint Server