
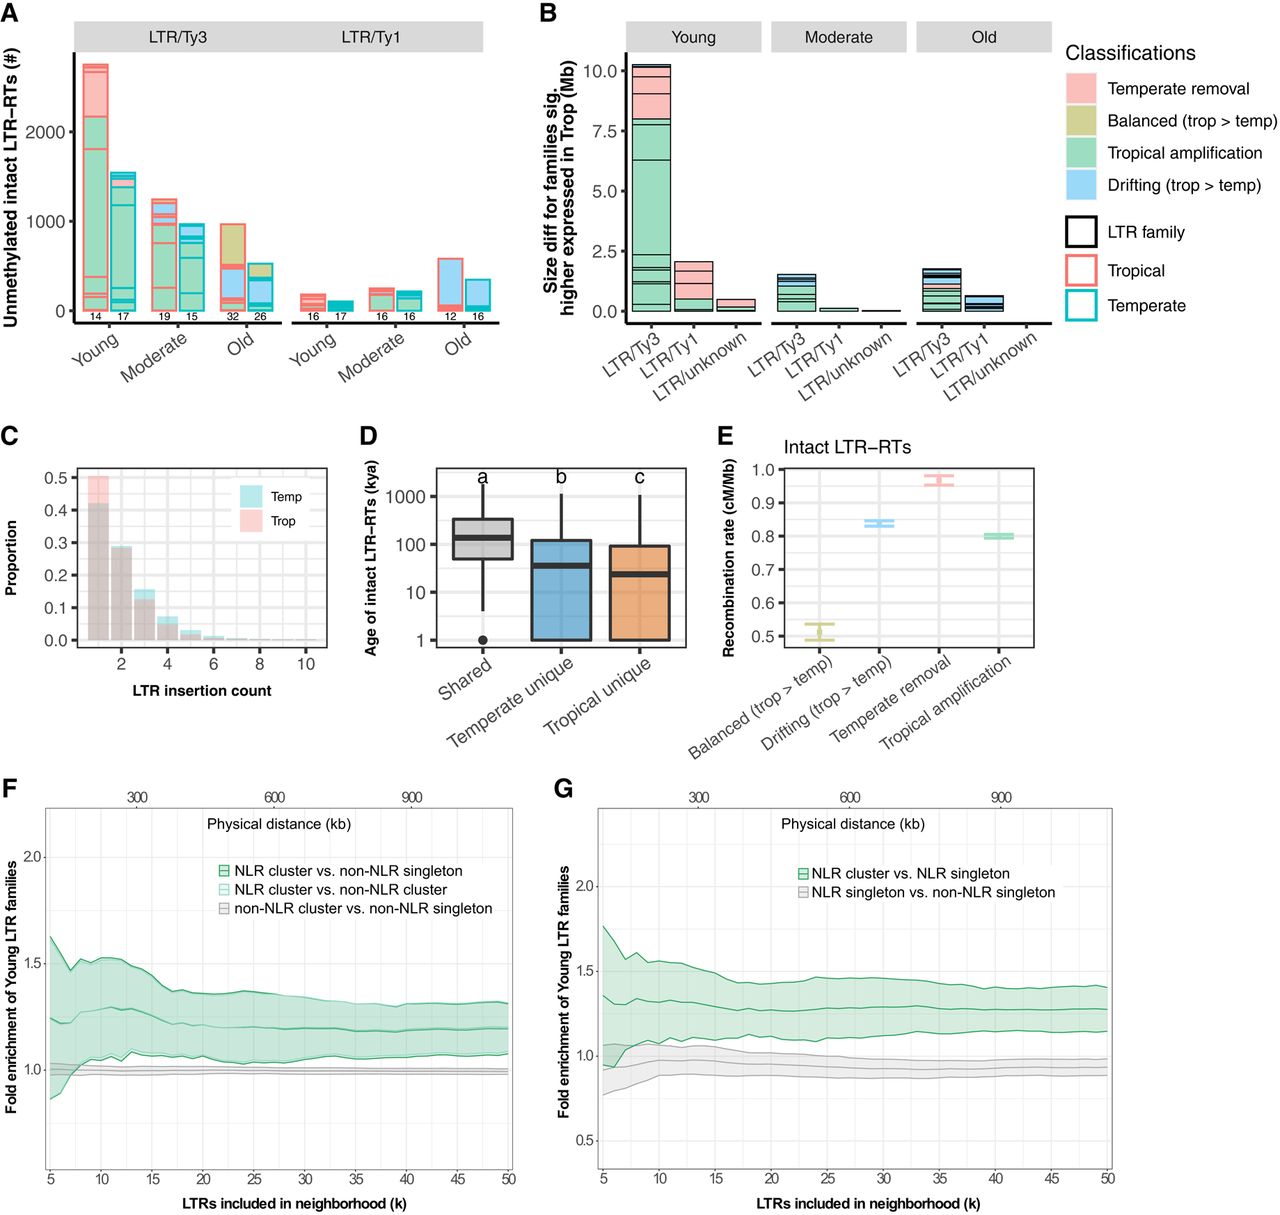
Molecular characterization of LTR families in maize. (A) The number of intact LTR-RTs carrying unmethylated regions. Data from tropical and temperate genomes are shown in side-by-side red and blue boxes, respectively. The number of families represented is indicated below each column. (B) The accumulated family size difference between tropical and temperate genome for LTR families expressed significantly higher in at least one tissue (and with consistent directionality in all tissues with expression) in tropical genomes. (A,B) The size of each box represents the number of LTR elements or effect size of each family, and only families that are larger in tropical genomes are shown. (C) LTR insertion frequency spectrum in tropical (pink) and temperate (blue) genomes. Only sites younger than 20,000 years ago were kept to increase accuracy of the polarization of the spectrum. No missing data filter was applied. (D) The age of intact LTR elements that were shared or unique in tropical and temperate genomes. The y-axis was log10-scaled. Different letters indicate significant differences in age (Tukey's HSD, P < 0.05). The box shows the median, upper, and lower quartiles. Whiskers indicate the 1.5× interquartile range. Black dots indicate outliers. (E) Mean recombination rate for genomic neighborhoods of all intact LTR-RTs. Error bars indicate the 95% confidence interval estimated from 1000 times of bootstrap resampling. (F,G) Fold enrichment of Young LTR family compared to Old LTR family neighborhoods of NLR gene clusters compared with non-NLR gene clusters (F) and NLR singletons (G). Nonsignificant comparisons shown in gray. x-axes are the number of intact LTR-RTs (k) found in the gene neighborhood. Lines indicate the mean values for all NAM lines, and the ribbon indicates the standard deviation within the population.


