
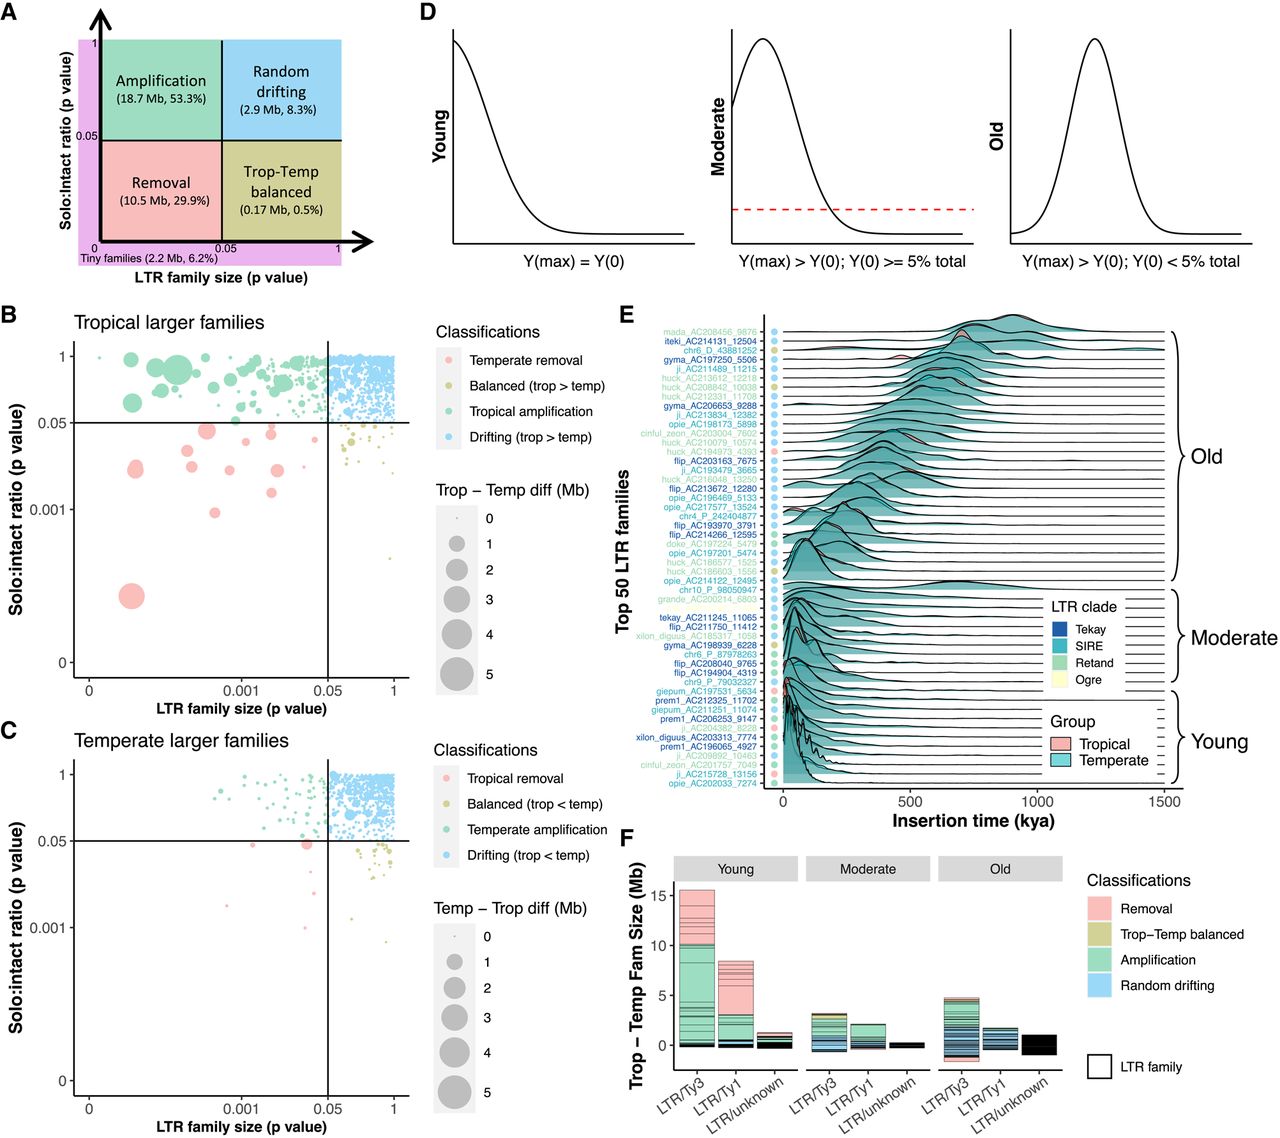
Contribution of LTR amplification and removal to genome size differentiation. (A) Classification schematic for LTR families based on solo:intact ratio and size differentiation between tropical and temperate genomes. Numbers (in Mb) indicate cumulative differences in family sizes between tropical and temperate genomes and their contribution to total TE differences. (B) LTR family classification for families that are larger in tropical genomes. (C) LTR family classification for families that are larger in temperate genomes. In both B and C, each dot represents an LTR family, and the size of each dot scales to the absolute family size difference, and x- and y-axes were log10-scaled. Removal families having an inconsistent solo:intact ratio contributed only 0.39 Mb to TE content variation and were removed from downstream analysis (Methods). (D) Classification schematic for age of LTR families based on the peak frequency of insertion time. (E) Age landscapes of the 50 largest LTR families in tropical (pink) and temperate (blue) maize genomes, with overlaps shown in green. Dots indicate family classifications using the coloring scheme shown in A. Clade-level classification of LTR families is denoted with different colors on the y-axis. The insertion time of LTR elements was estimated using the maize mutation rate µ = 3.3 × 10⁻⁸ per base pair per year (Clark et al. 2005) and assuming a constant molecular clock. (F) The accumulated TE size differentiation contributed by different LTR superfamilies (Ty3, Ty1, and unknown) in different age groups (Young, Moderate, and Old). Each box represents the contribution of an LTR family.


