
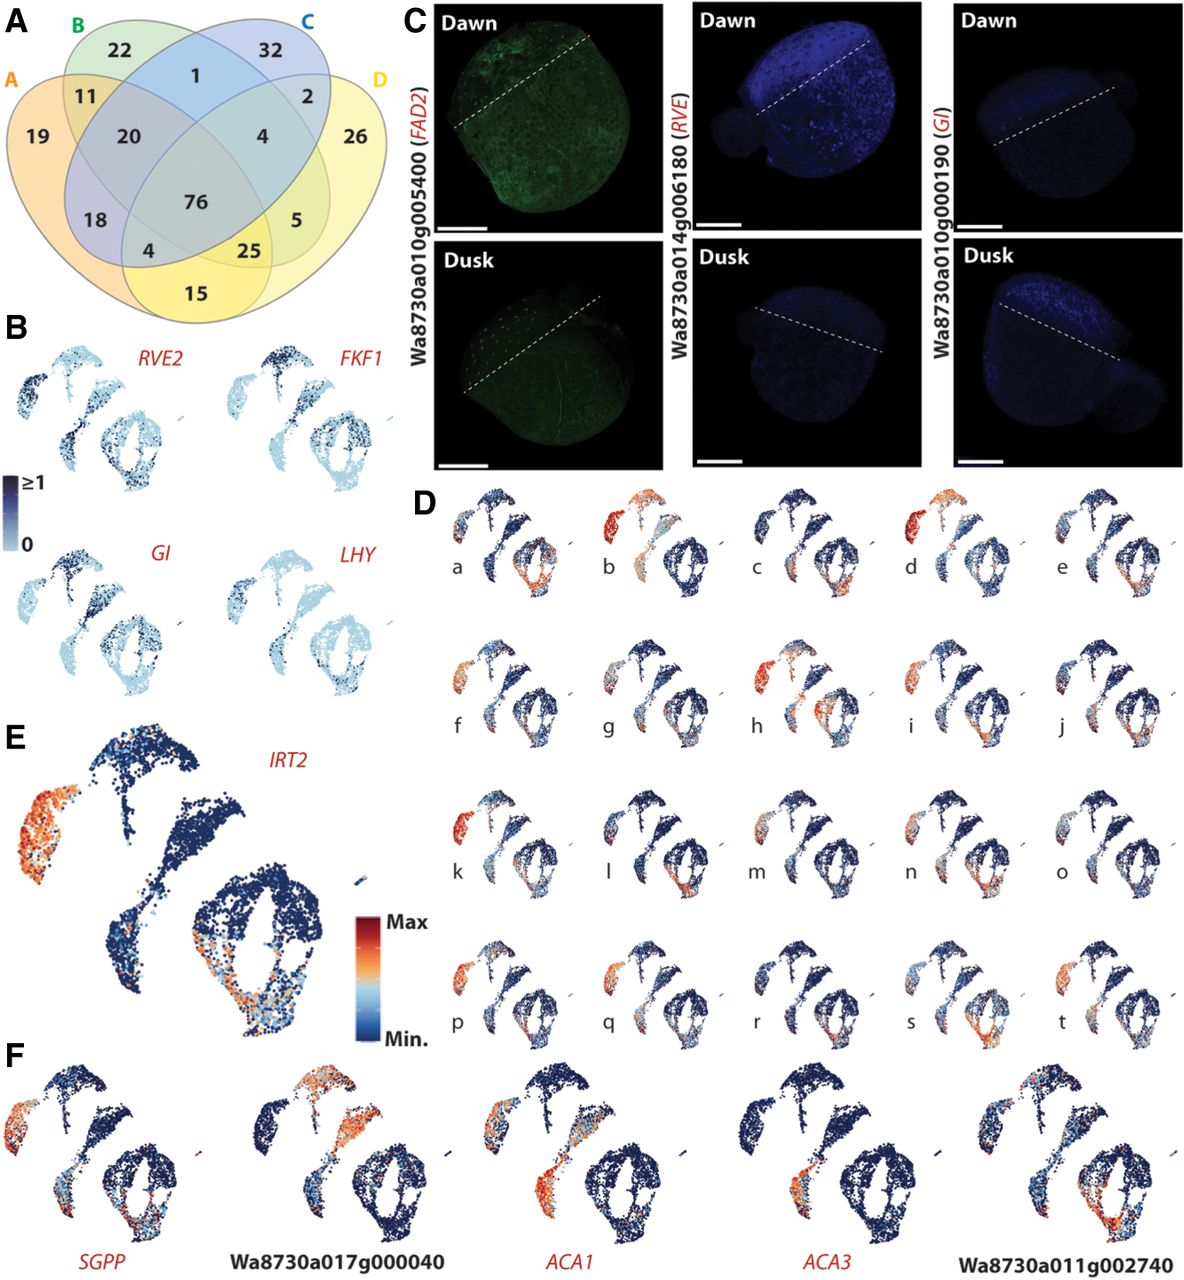
TOD responses vary depending on cell type and on life in water versus air. (A) Venn diagram illustrating the overlap of TOD DEGs across superclusters; 76 genes are TOD regulated in all four supercluster comparisons, but many genes show a tissue-dependent TOD response. (B) UMAP projections of normalized expression for the core circadian clock genes REVEILLE (RVE), GIGANTEA (GI), FLAVIN-BINDING, KELCH REPEAT, FBOX (FKF1), and LATE ELONGATED HYPOCOTYL (LHY) reveal the expected strong TOD responses. (C) Expression of select dawn or dusk markers imaged at dawn (top) and dusk (bottom) using PHYTOMap shows strong preferential expression at dawn (left two), or dusk (right). Composite images are projections of 13–15 z-stack sections of 2–3 µm each. For information on genes examined, see Supplemental Table S2. Scale bars, 250 µm. (D) UMAP projections of example genes showing differential expression (DE) between dusk and dawn conditions as well as a level of cell type specificity. Expression for each gene is plotted on an integrated plot of data sets: (a) Wa8730a017g001020, (b) Wa8730a016g003000, (c) Wa8730a017g003930, (d) Wa8730a005g008830, (e) Wa8730a006g006550, (f) Wa8730a003g006530, (g) Wa8730a006g005980, (h) Wa8730a019g001460, (i) Wa8730a020g001730, (j) Wa8730a010g005400, (k) Wa8730a012g004550, (l) Wa8730a002g000180, (m) Wa8730a006g005670, (n) Wa8730a003g004150, (o) Wa8730a002g007540, (p) Wa8730a002g007630, (q) Wa8730a015g001450, (r) Wa8730a018g000010, (s) Wa8730a002g010730, and (t) Wa8730a010g003830. (E) UMAP projection of IRT2 (Wa8730a011g002740) expression in the integrated dusk/dawn atlas showing a strong tissue-specific TOD response. (F) UMAP projections of further genes showing tissue-specific TOD responses. (SGPP) 8730a011g001940, (ACA1) Wa8730a020g000810, and (ACA3) Wa8730a017g000040.


