
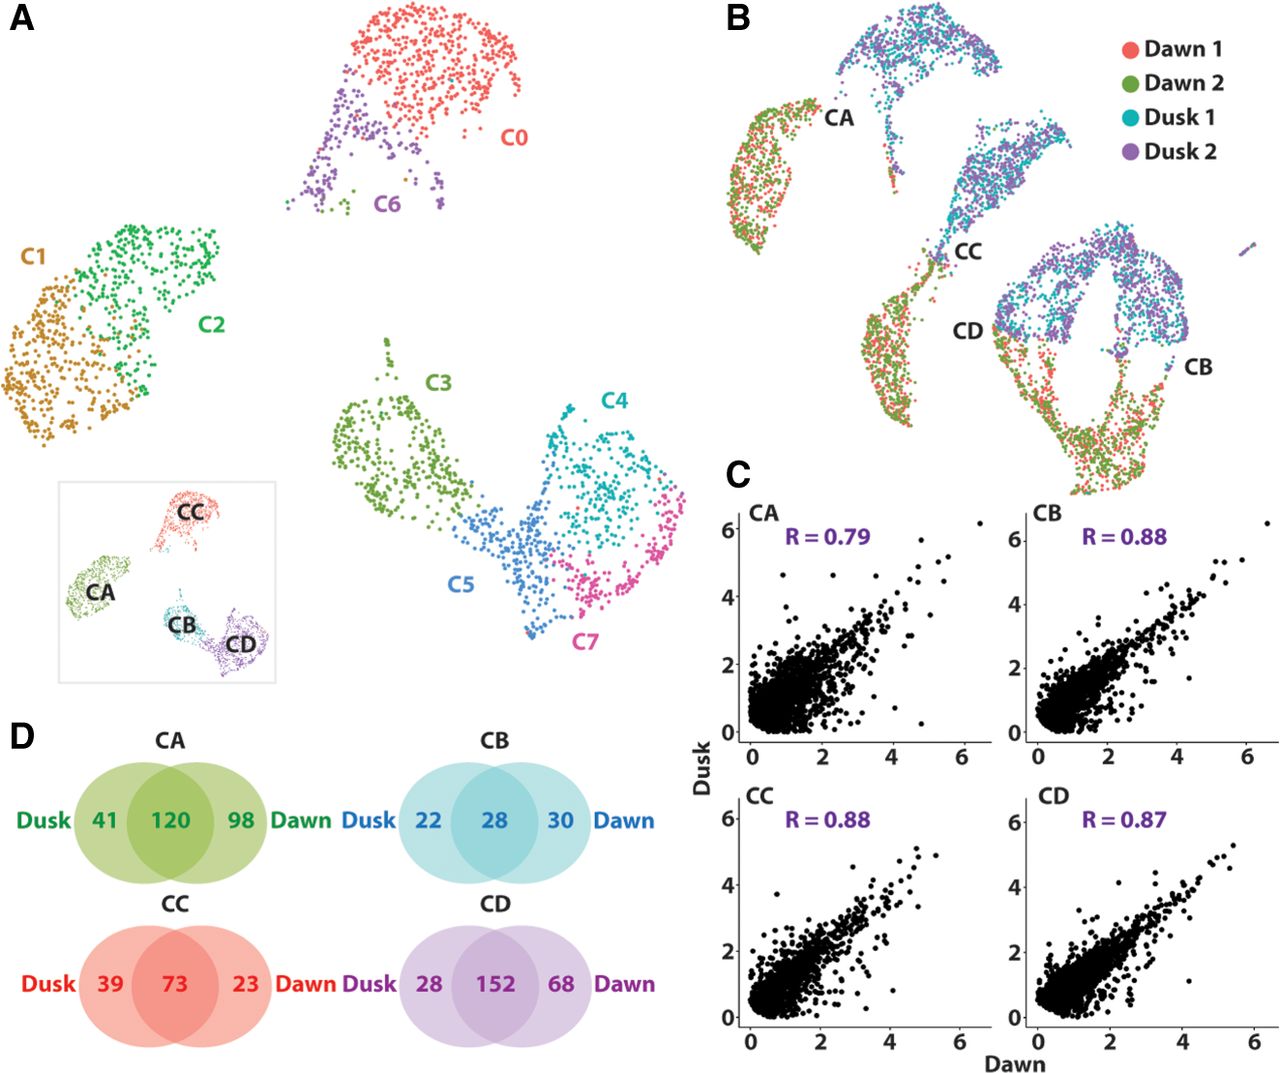
Dusk and dawn transcriptomes are well conserved, although many genes show TOD responses. (A) UMAP visualization of the dawn scRNA-seq atlas reveals eight distinct clusters, organized around four superclusters (inset). (B) Integration of dusk and dawn data sets reveals a mirror image arrangement of superclusters, indicating a strong conditional transcriptome distinction that does not override cell identity. (C) Gene expression correlation between dusk and dawn replicates of distinct superclusters reveals high correlation. Genes expressed in >10% of the cells in each supercluster were used in each instance. (D) Venn diagrams showing just a partial conservation of DEGs between superclusters of dusk and dawn conditions, indicating that sampling across TOD identifies unique tissue-specific DEGs. Identities of superclusters CA, CB, CC, and CD are matched across data sets.


