
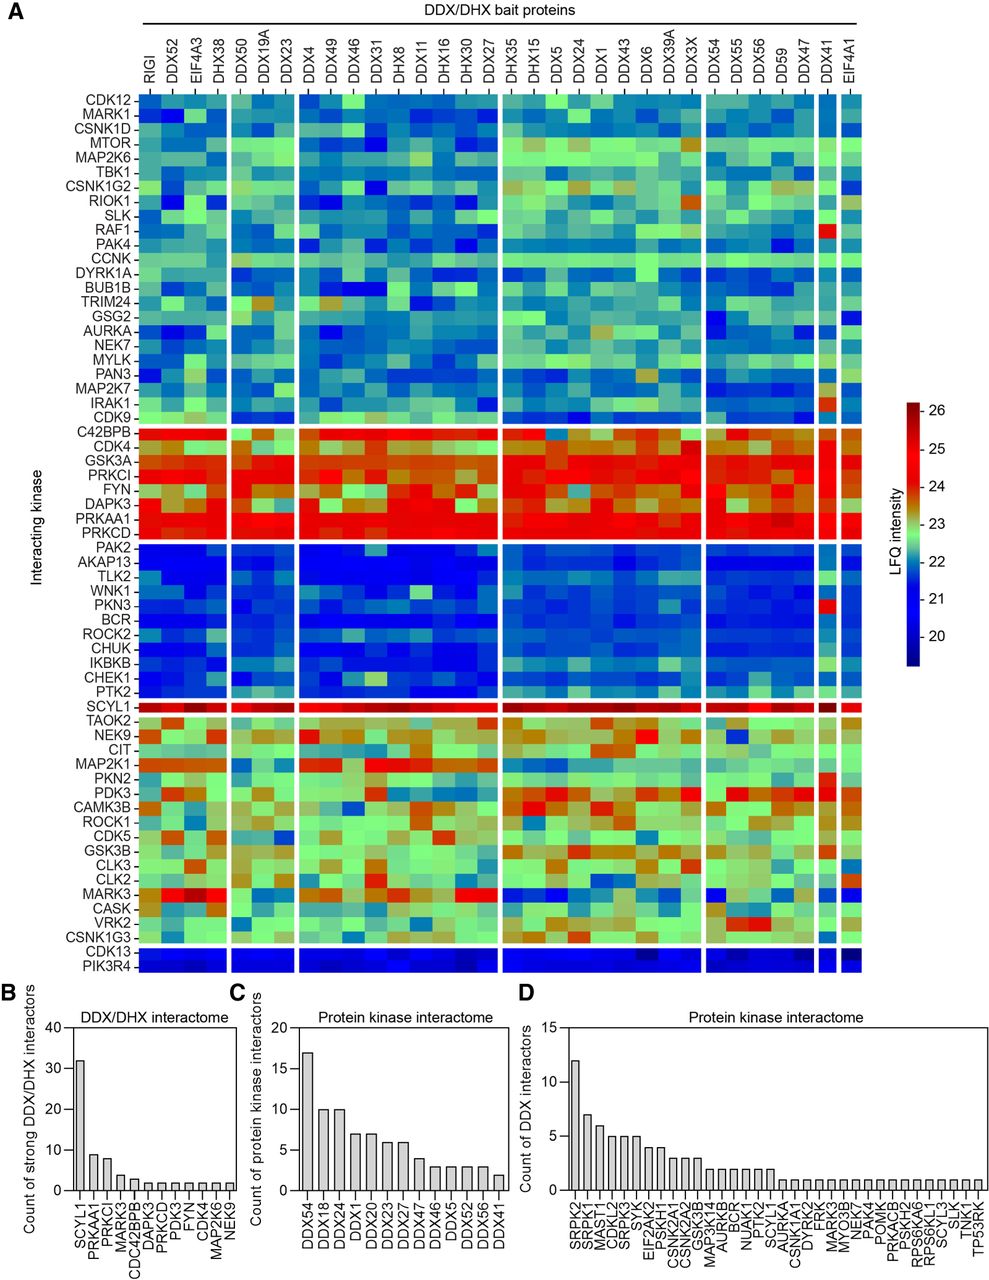
DDX/DHX proteins bind to protein kinases in HEK293T cells. (A) Heatmap of the interacting kinases (rows) against all DDX/DHX baits (columns). The empirical cumulative distribution function (eCDF) of the IP-MS data set was calculated, and the eCDF probabilities of the interacting kinases were plotted as a heatmap. Protein kinases (rows) of the heatmap were sorted by the values of the DDX/DHX baits (columns) with the highest value. The DDX/DHX baits (columns) were sorted by the values in the protein kinases (rows) with the highest value. Therefore, the highest eCDF value is in the top left corner, and the heatmap is sorted by the first row and first column. The heatmap was visualized using the seaborn library (https://doi.org/10.21105/joss.03021). (B) Bar plot indicating the number of DDX/DHX proteins interacting strongly (eCDF > 0.75) with the indicated kinase as retrieved from the DDX/DHX interactome screen. (C) Bar plot indicating the number of kinases interacting with the indicated DDX proteins as identified by Buljan et al. (2020). (D) Bar plot indicating the number of DDX proteins interacting with the indicated kinase as identified by Buljan et al. (2020).


