
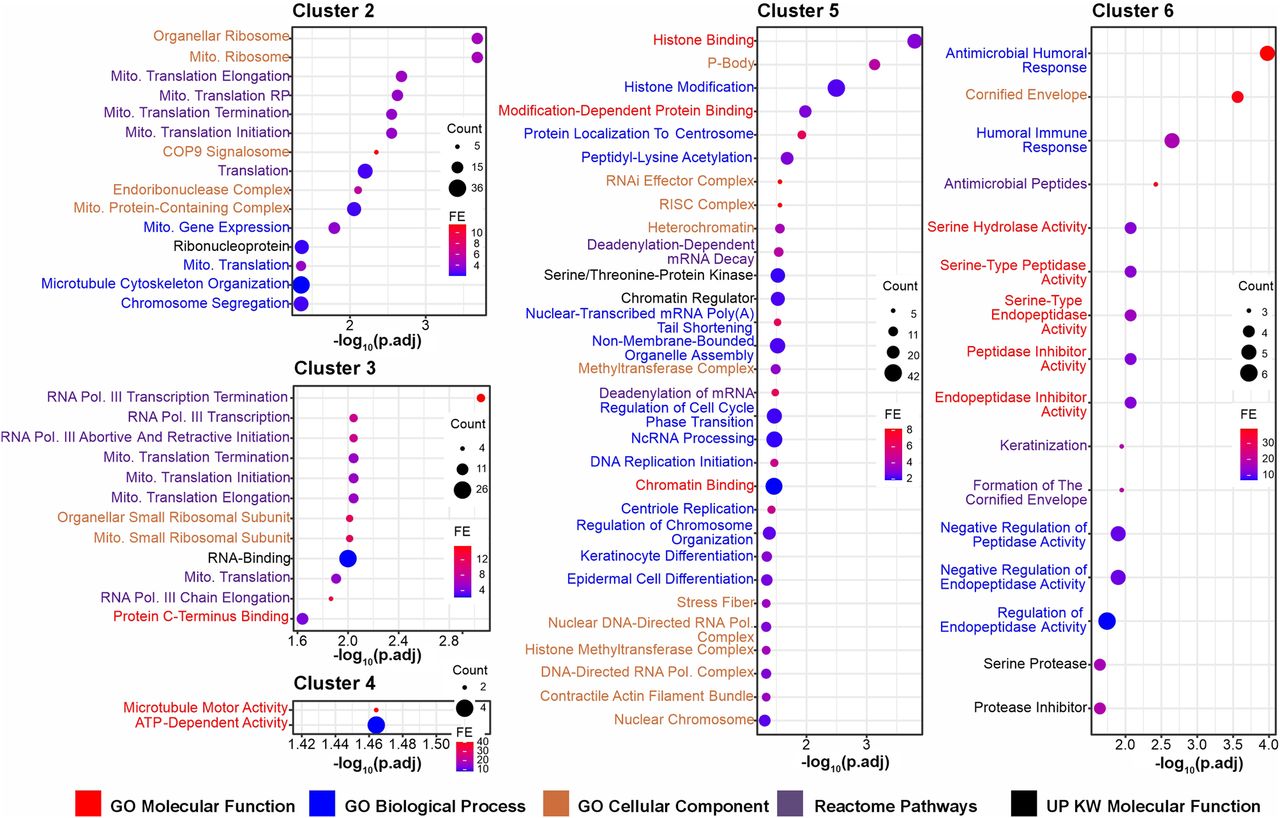
Figure 2.
Overrepresentation analysis (ORA) of DDX/DHX interactome clusters. ORA was conducted for DDX/DHX interactome clusters 2–6. Dot plot enrichment containing results for pooled ontology categories and sorted by –log10 (P.adjusted) values. The size of the dots indicates the number of proteins in the category (“count”), and the color of the dots reflects the fold-enrichment (“FE”). Enriched ontology terms are color-coded: GO molecular function is red; GO biological process, blue; GO cellular component, orange; reactome pathway, purple; and UniProt Keyword (UP KW) molecular function, black.


