
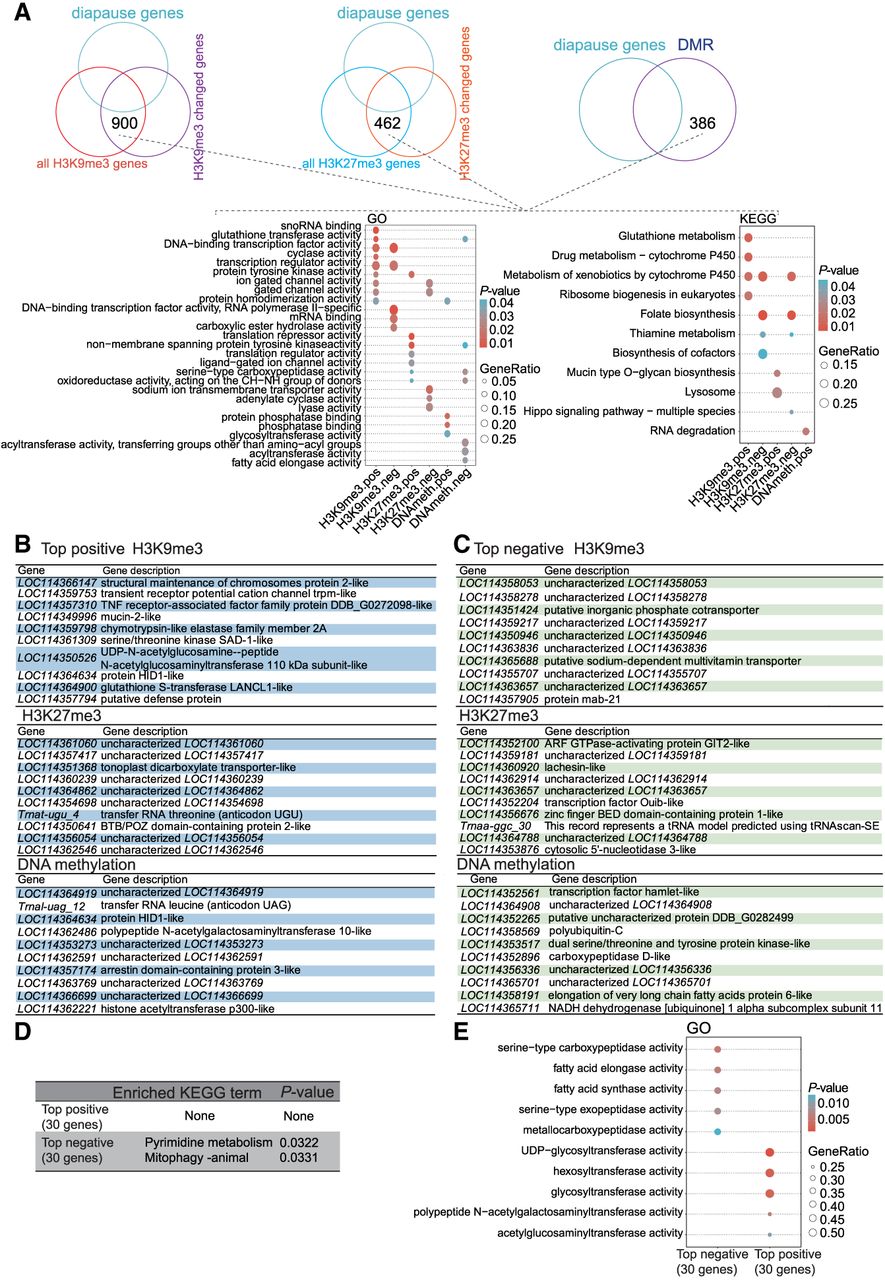
Figure 8.
Analysis of previously unreported gene profiles in diapause reveals potential new regulators for diapause. (A) Comparative GO enrichment analysis and comparative KEGG enrichment analysis for the overlapping gene group shown in the upper panel (cf. with Fig. 6A–C) for H3K9me3, H3K27me3, and DNA methylation, respectively. (B,C) The top positive and top negative gene lists from the gene group indicated at the top of panel A. (D) Comparative KEGG enrichment analysis of the top positive and top negative genes. (E) Comparative GO enrichment analysis of the top positive and top negative genes.


